Spontaneous Current Analysis
Source:vignettes/articles/spontaneous-current-analysis.Rmd
spontaneous-current-analysis.RmdThe goal of spontaneous current analysis is to identify and analyze
currents while avoiding spikes from stimulus artifacts and noise. This
article will show you how to analyze spontaneous currents in raw .abf
recordings using Event Detection in Clampfit. The data will then be
ready for further analyses with patchclampplotteR.
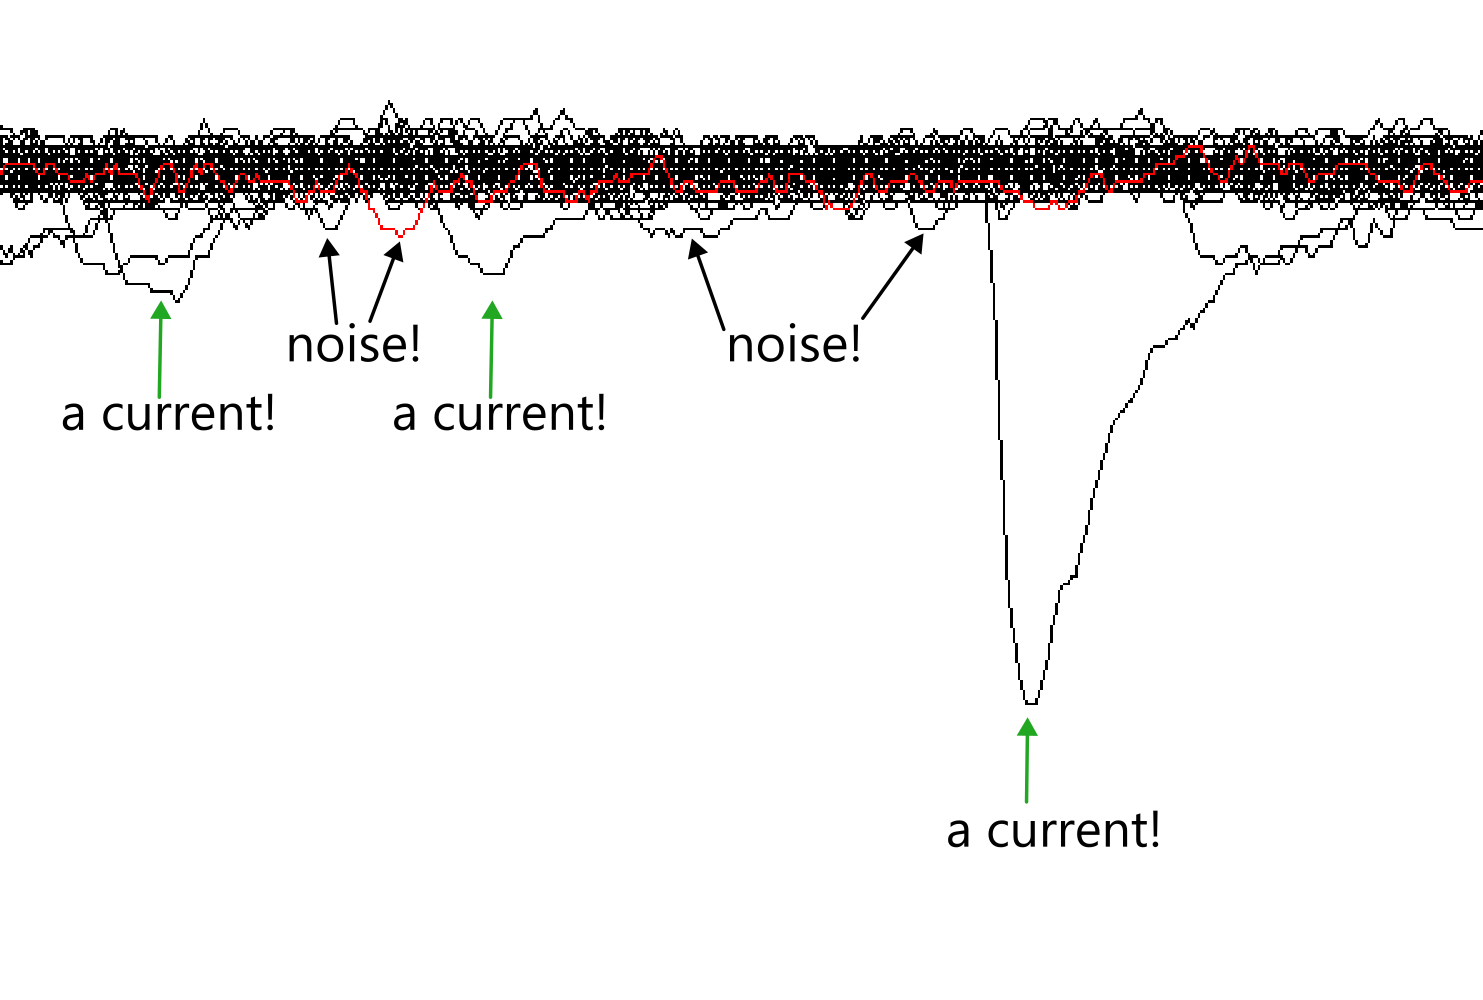
There are many advanced approaches to noise exclusion in electrophysiological recordings (see Wang et al., 2023; Kudoh & Taguchi, 2002; and Pernía-Andrade et al., 2012 for some methods). I am using a simple threshold method, where any spikes below the threshold are not counted as synaptic events.
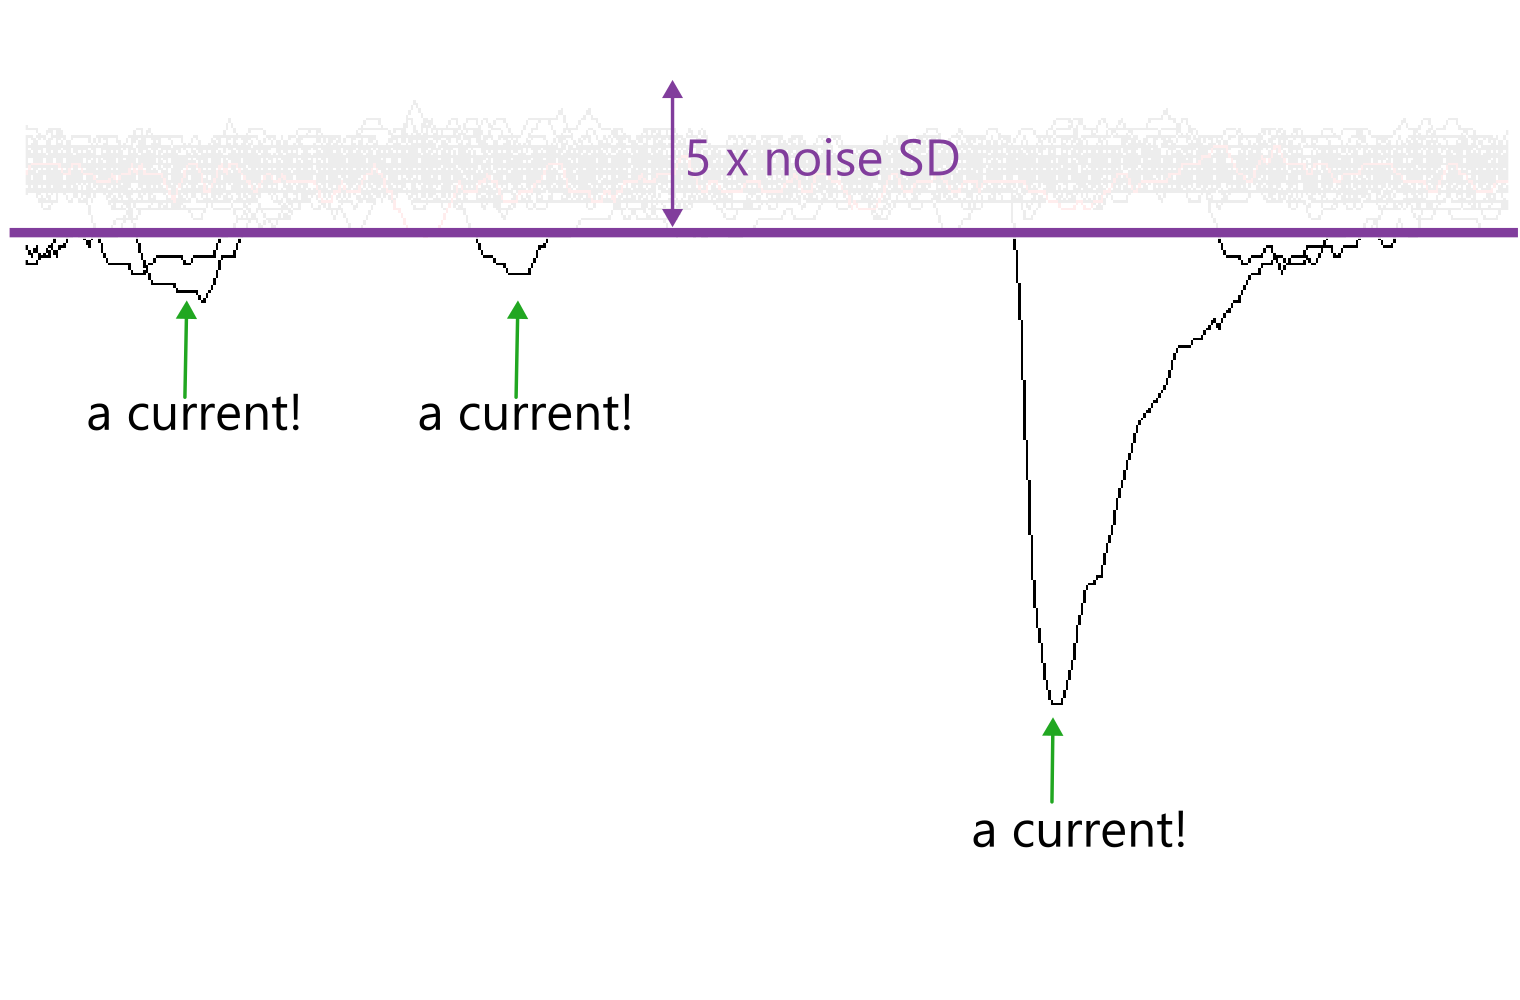
In this method, the threshold is five times the standard deviation (SD) of the noise amplitudes during a flat baseline region. This is comparable to the root mean square noise (RMS) used in MiniAnalysis.
Combine recordings
Note The data from our lab is not a continuous 30-minute recording. We pause the recording every 5 minutes to obtain parameters like access resistance and capacitance from the membrane test before resuming recording. If your data is already a continuous file, you can skip steps 1-2.
You may already have a concatenated file from your Evoked current analysis. This also means you can skip steps 1-2.
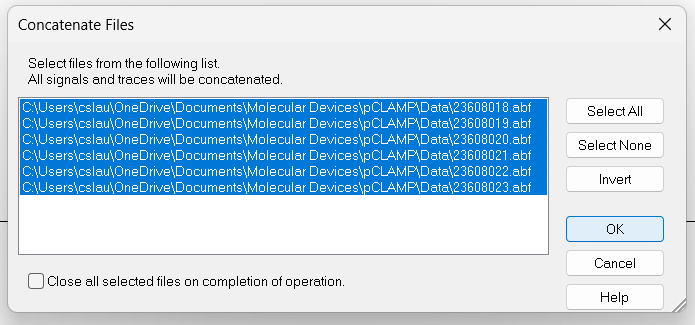
Open the first .abf file in your recording series, and use the
Next Filebutton to quickly open all files in the series.Click on
Analyze->Concatenate Filesand select all files that belong to a recording from a single cell. All the recordings will be combined into a continuous recording with no gaps.
View recording
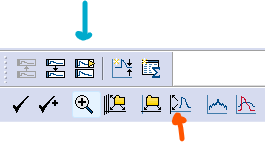
Click on the
Show Aquistion Signalsbutton and thenPrevious Signal(blue arrow in the figure below) to view the sweeps showing changes in current (Im_primary ()). The traces should all be stacked on top of each other, but if they are not, click onView->Data Display->Sweeps.You can also click on the
Auto Scale All Y Axesbutton (orange arrow) to help you see the data faster.
Create data sheet
- Create a
.csvfile with five columns:
-
letterA character value that is a unique identifier for a single recording. Used to link data sets for evoked or spontaneous currents and cell-characteristics. -
IDA character value for the recording filename. -
recording_numA numeric value representing the recording number. This was incorporated before we switched to concatenating all recordings into one, but it needs to remain here to prevent breaking previous projects. It should be set to 1. -
traceA numeric value representing the trace (automatically generated in Clampfit) where the current occurred. -
amplitudeA numeric value representing the amplitude of the evoked current in pA. -
time_of_peakA numeric value representing the time of the peak in milliseconds relative to trace number. This is automatically calculated in Clampfit.
Identify threshold
To reduce the risk of identifying noise as spontaneous currents, we must set a detection threshold.
- Zoom into a region of the recording with few spontaneous currents and minimal noise. Place Cursors 1 and 2 around this region.
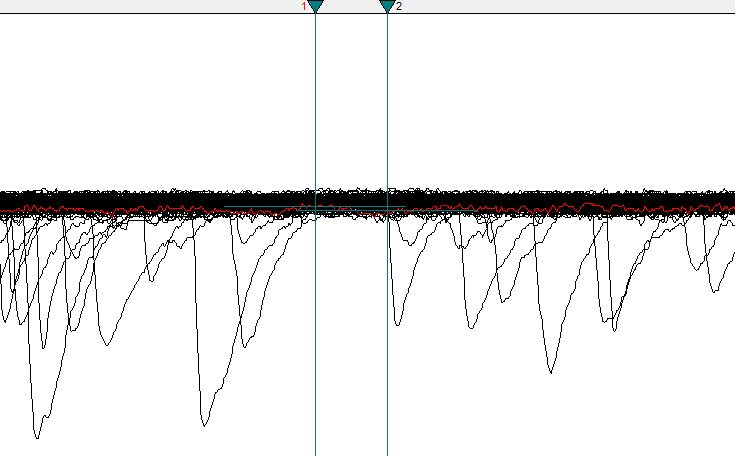
Cursors 1 and 2 are surrounding a good baseline region.
You may need to view a smaller number of traces if there are too many to find a clear region. Use
View->Select sweepsand select a smaller range.
Click on the Statistics button (a small icon with a summation symbol on top of it) or press
Alt+s.Set the following settings to measure noise amplitude in the baseline:
- Trace Selection: Choose
Im_primary ()andAll Visible Traces. - Peak Polarity:
Im_primary,Negative-going - Baseline Region: Mean level
Cursors 1..2 - Search Region 1: Range:
Cursors 1..2 - Destination Option:
Replace results in sheet(prevents you from accidentally copying old data) - Column Order:
Measurement, Region, Signal - Measurements:
Peak_amplitude
Warning! If you have previously used Clampfit for other analyses (for example, Action Potential Analysis or Evoked Current Analysis you may need to double-check these parameters. For example, ensure that only ONE search region is enabled!
To verify if only
Search Region 1is enabled, click on the up-arrow next to the search region number box. IfSearch Region 2is also enabled, uncheck it to avoid confusion in the results page.
Click on the Results sheet (
Window->Results1). On the results page, copy the values in theR1S1 Peakcolumn. Paste these into the A column of a blank Excel sheet.In cell B1, type the formula
=AVERAGE(A:A). This will produce the mean noise amplitude.In cell B2, type the formula
=STDEV.S(A:A)to get the standard deviation.In cell B3 type
=B2*5. This value is the five times the standard deviation of the mean noise amplitude, and it will be the threshold value for this recording (write this in your lab book near your notes on this recording).
If the currents are negative-going (they probably are) the threshold value will be the threshold value x -1 (e.g. a threshold of 2.51 will be -2.51).
- You may want to save this Excel sheet for later use (just replace the data in the A column each time).
Set Event Detection parameters
Click on
Event Detection->Threshold search. The recording will look faded, and some new horizontal cursors will appear. Set the Event Polarity toNegative-going.In the
Threshold Searchbox, set theBaselineto 0 andTrigger (pA)to the threshold value that you found in step 12.If there are large artifacts, enable the
Reject (pA)marker and drag it to a level below the artifacts. Any event with an amplitude larger than this reject zone will be excluded.
Note If you need to remove an entire trace, click on it and press the
Deletekey. This will hide the trace Later, you will select visible traces for the analysis.
If you are having issues with noise detection, feel free to experiment with the other settings such as the pre- and post-trigger lengths and noise rejection.
Set the search region to
Full Trace. Click theSelectbutton and ensure that the optionAll Visible Tracesis selected.
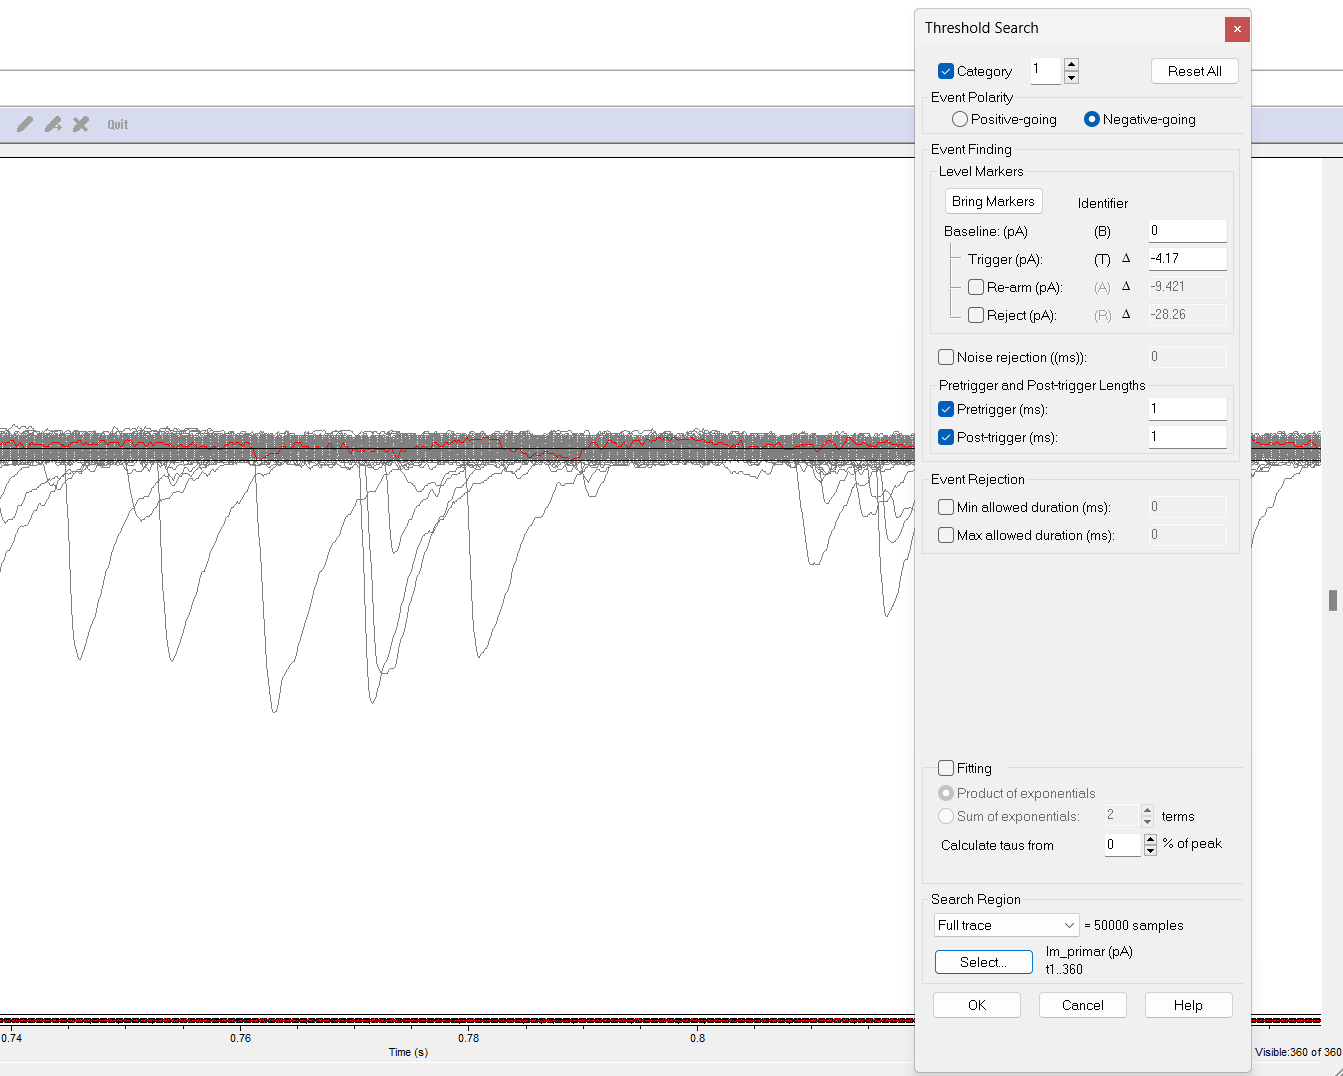
You can double-check that you have selected the correct number of sweeps (here it should be t1..360) by checking the total sweep number in the bottom right corner (Sweep 360 of 360).
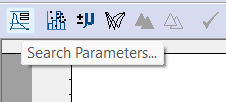
- Click OK to close the dialog box. If you ever need it again, click
on the
Search Parametersbutton on the bottom left side of the toolbar.
Identify currents
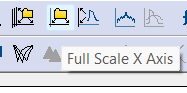
- Click on the
Full Scale X Axisbutton to view the entire trace.
 > Warning! If you do not check “Full Scale X axis”,
Clampfit will continuously scroll through the recording and it will take
much longer to run.
> Warning! If you do not check “Full Scale X axis”,
Clampfit will continuously scroll through the recording and it will take
much longer to run.
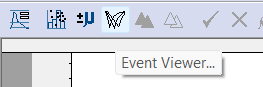
- The Event viewer window should pop up, but if not, click on the
Event Viewer button. On the lower-right side, click the
Optionsbutton, and then do the following:
- Uncheck
Open Event Viewer automatically when starting event detection - Uncheck
Continuous autoscale - Close the Event Viewer window
Warning! If you do not close the Event Viewer (and perform the other items in Step 21), Clampfit will try to refresh and resize this window each time a current is detected. It will likely freeze and crash the software.
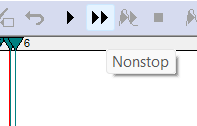
- Click on the Nonstop button to initiate Event Detection. Clampfit will draw a blue dot on each event. This may take a few minutes for large files.
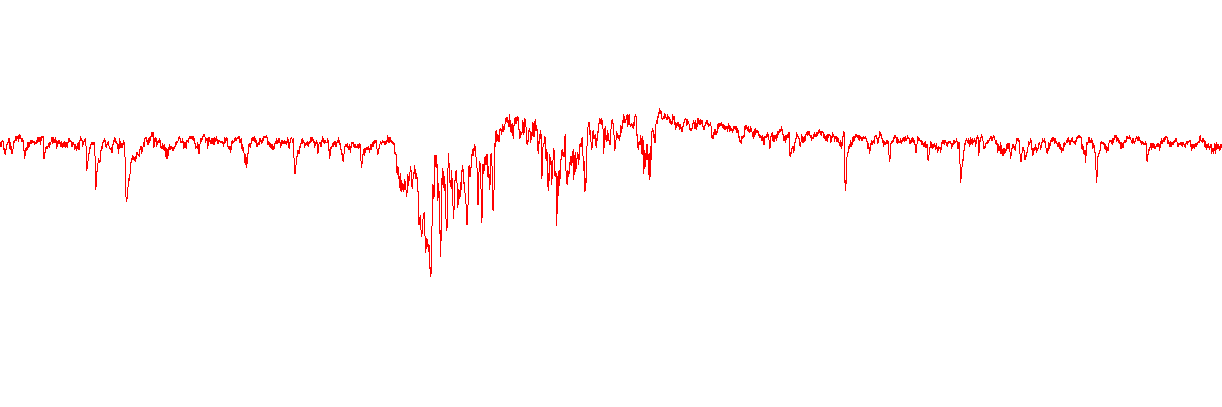
- When the Event Detection has stopped, the nonstop button will become greyed out there will be a small notification sound. This is what the recording will look like after all events have been detected.
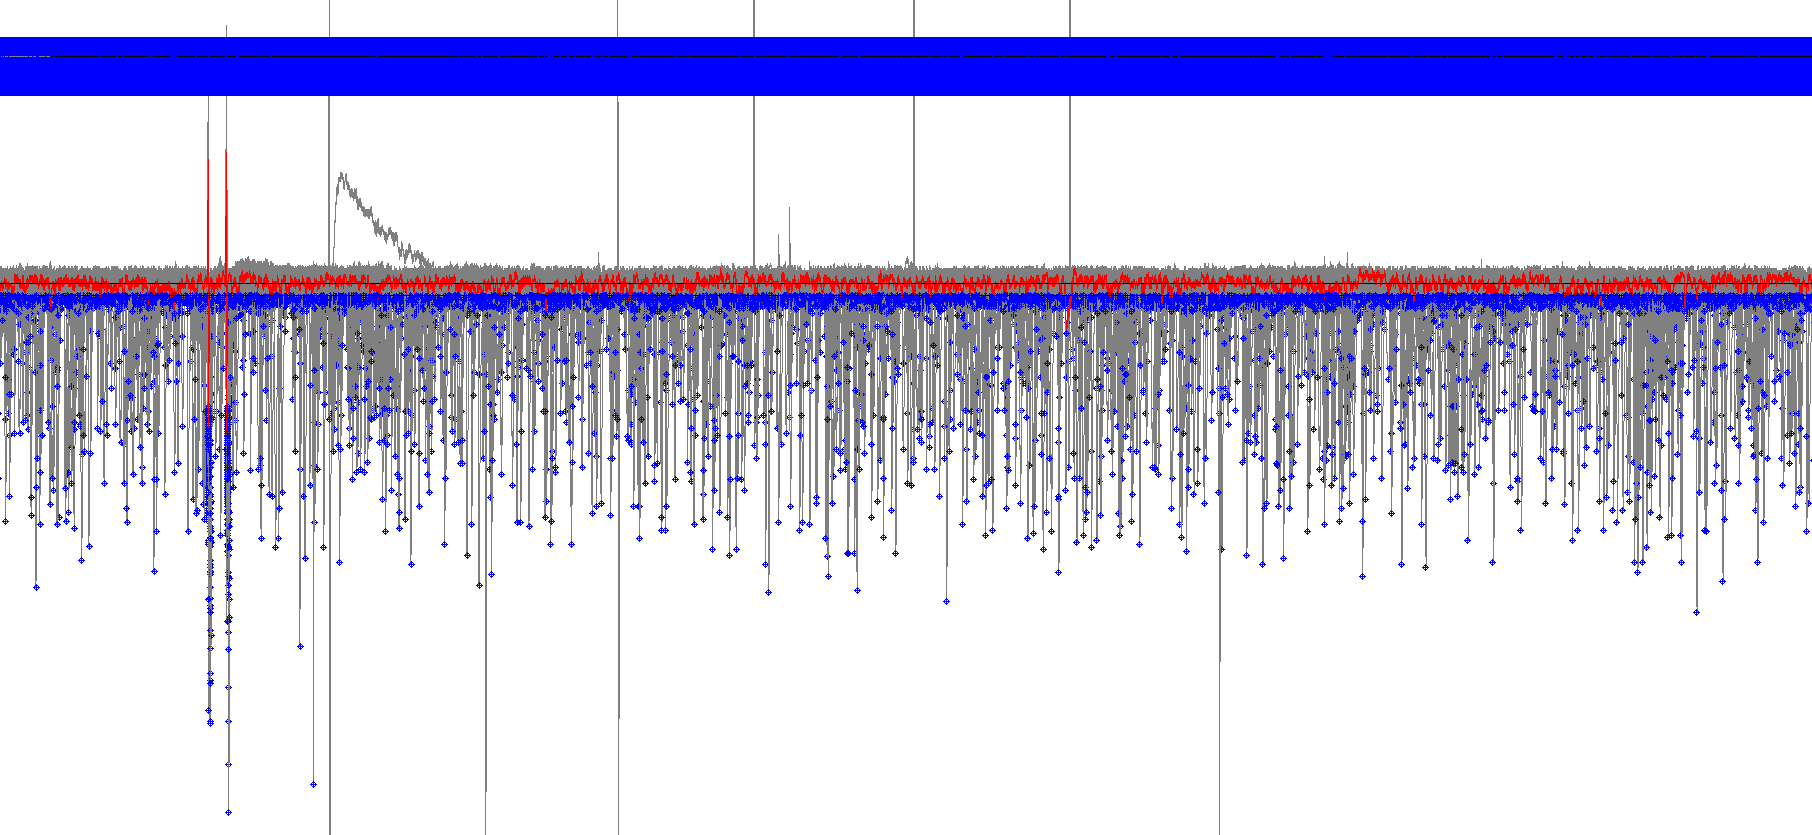
In this screenshot, events are highlighted in blue with a sketch of the event placed above. There are so many spontaneous currents, that the sketches have turned into a solid blue bar!
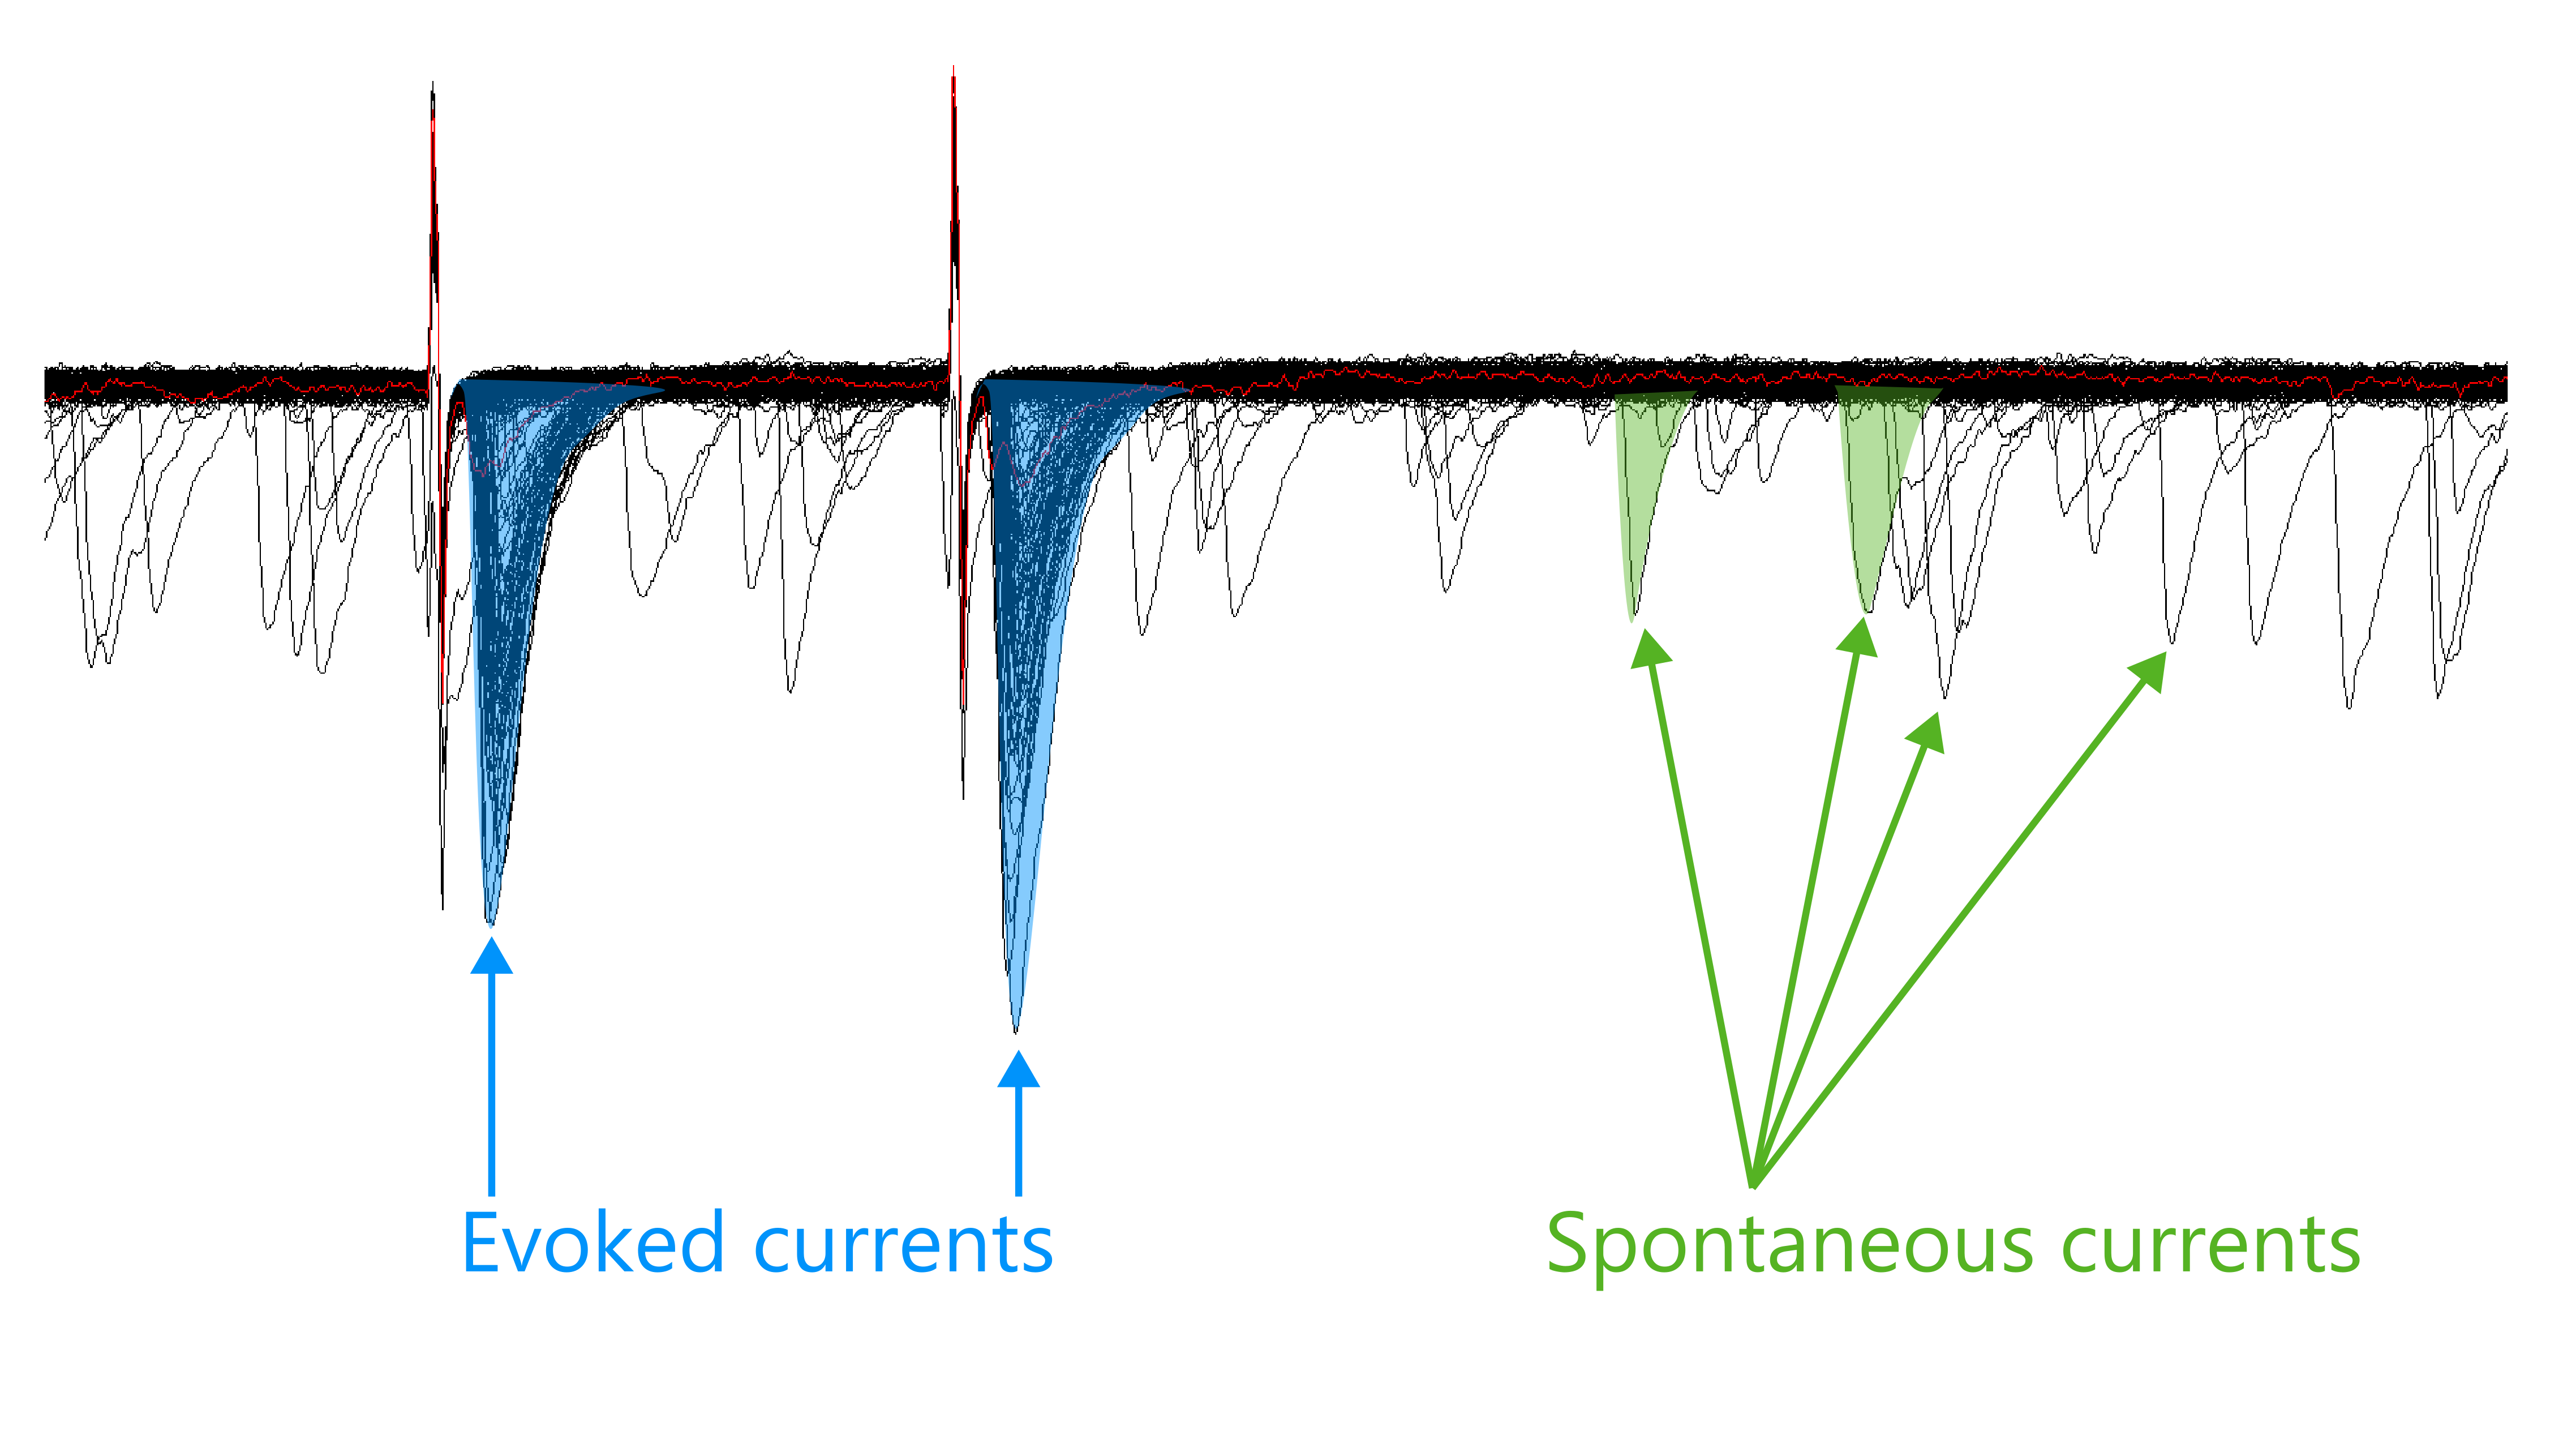
Exclude evoked currents
Since this analysis focuses on spontaneous currents only, you will need to exclude any stimulus artifacts and evoked currents that were included in the event detection. Clampfit does not have an easy way to select multiple currents at once. However, one work-around is to create a plot of current amplitude over time and select points to delete.
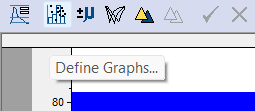
- Click on the
Define Graphsbutton and choose theScatterplotoption.
Set the x-axis to
Time to Peakand the y-axis toPeak amplitude.You will see a plot that shows blue dots arranged in a rough shape that resembles the blue dots in the recording file in Step 22. Click, squeeze, and drag a line on the x-axis to change the display range of the graph.
Note, I have analyzed a file with fewer sweeps to reduce run-time and strain on my computer while making this tutorial.
Note: The newer version of Clampfit (from pClamp 11) appears to be applying a rounding function to the graph, which creates parallel lines of dots. In reality, spontaneous currents are not perfectly aligned like this.
- Click and hold down your cursor button at an area close to the bottom left of the dots corresponding to the evoked currents and stim artifacts. While still holding down the mouse, move to the upper right corner to “draw” a box. This will select all points in the box that you outlined.
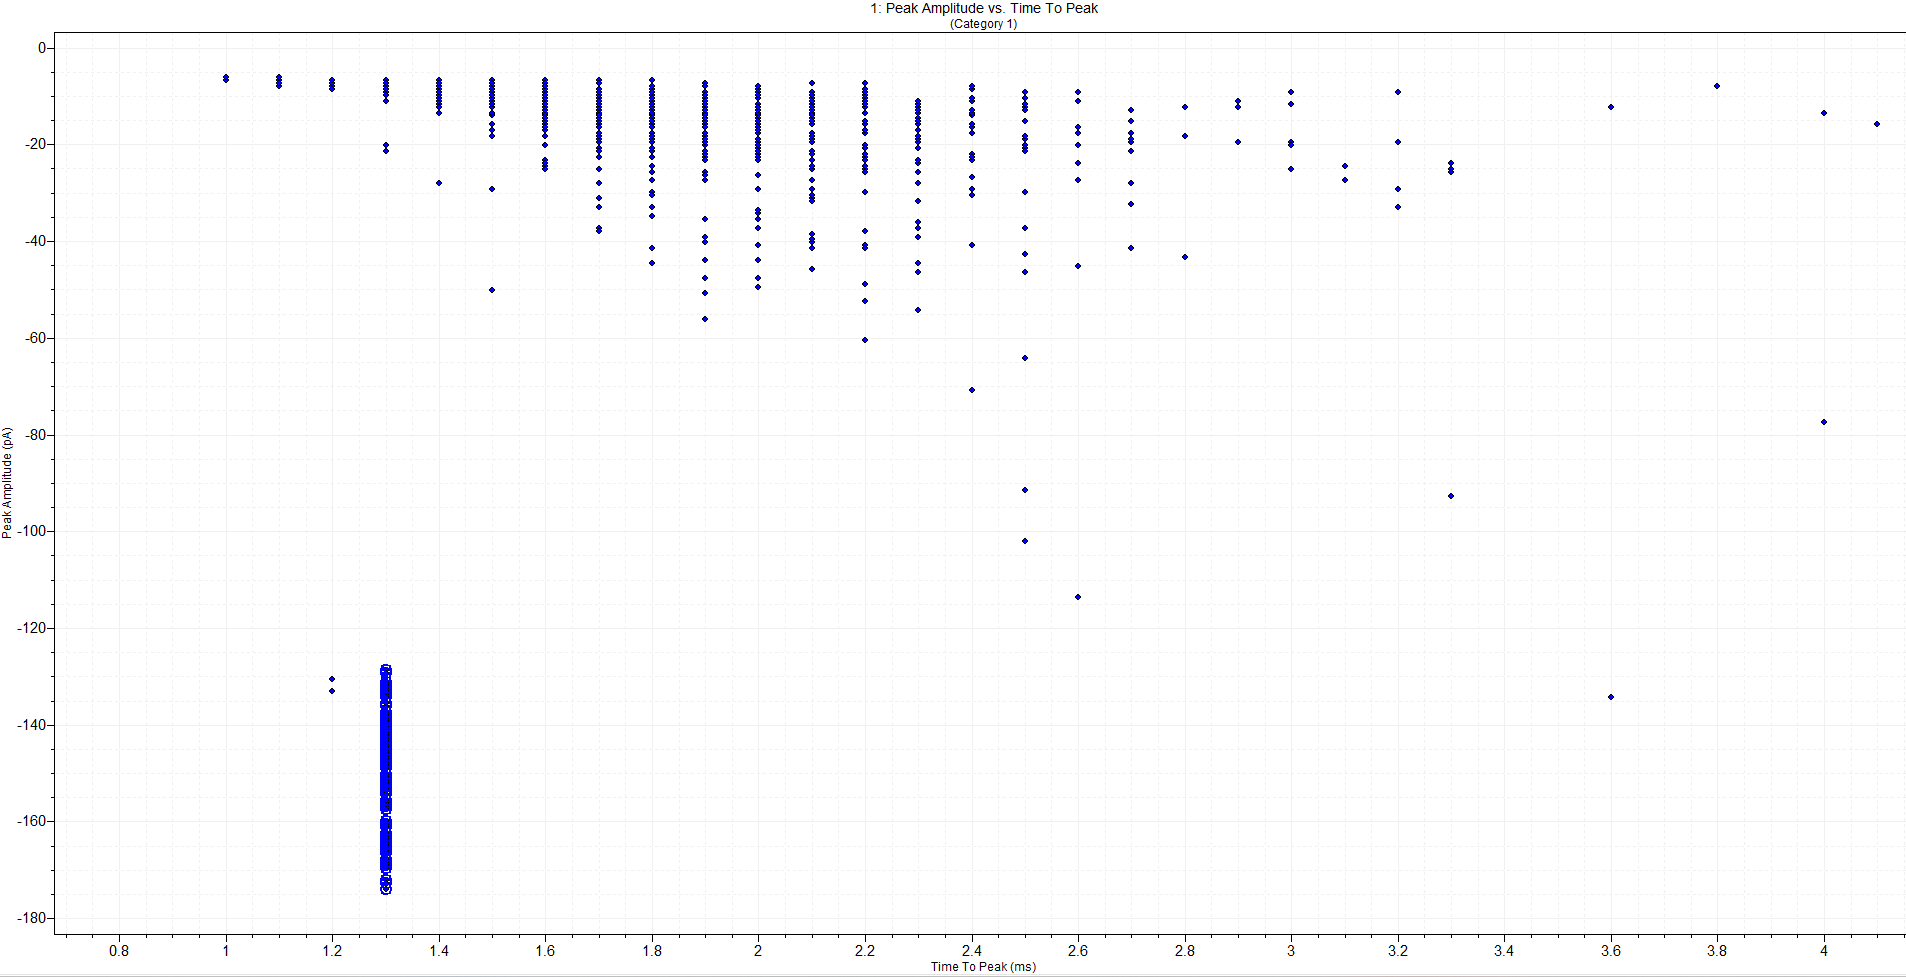
In this screenshot, notice how the stimulus artifacts are grouped together in one place. I have selected these points with my mouse.
Go back to the recording file and check that the selected values correspond to the stim artifacts and evoked currents. You may need to repeat steps 26 and 27 a few times to make sure that you have selected all non-spontaneous current events.
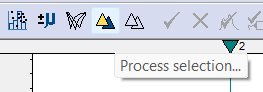
Click on the
Process Selectionbutton that looks like a yellow triangle overlapping a blue triangle.
 29. A dialog box will pop up. In the
 Process selection,
click on Change state and then Reject.
- When you are confident that you have removed all of the stim artifacts and evoked currents, it is time to save the results sheet as an Axon Text File.
- Click anywhere within the Results sheet.
- Next, click on (
Window->Results1orAlt+w+2) and thenFile->Save As(Ctrl+s). I would suggest creating a consistent naming convention, such asLetter-events, as inAA-events.atf,AB-events.atf, etc.
Note Sometimes the events will not save if you don’t click on a cell/row/anywhere within the Results sheet. This is possibly because the program does not know what sheet you want to save. Be sure to click somewhere in the sheet BEFORE you go to
File->Save As!
Copy required columns
- Open the
.csvfile that you created in step 5.
32a. Paste in the values from your results sheet. The values should go in the following columns:
-
Peak Amplitude (pA)->amplitude -
Time of peak (ms)->time_of_peak -
Trace->trace -
recording_numshould be1, if this is a concatenated file. Do not use other numbers, unless the file is split up into 5-minute segments (must be exactly 5 minutes). -
lettertype the name of the recording letter. -
IDtype the name of the baseline recording (e.g.20250209002.abf) to help you quickly find the original recording if needed.
recording_numis left-over from an earlier analysis approach that relied on all recordings being exactly 5 minutes long. In this old approach,recording_numwas part of a formula that calculated the total time (in min) from the start of the recording. Unfortunately, this approach falls apart if there are any recordings that are longer/shorter than 5 minutes. However, I have left this here to prevent breaking data in existing users’ projects.
Note I would strongly recommend using the filename of the first file in the series as the
IDcolumn, but write down the concatenated filename in your lab book as well. This is because Clampfit will auto-generate the concatenated file names (Concatenate001.abf,Concatenate002.abf, etc.). If you update your pClamp software, Clampfit will begin naming files again atConcatenate000.abf, and you could lose track of which file is which.
32b. Select the letter, ID and
recording_num columns, then double-click on the
+ sign on the lower right hand corner of the selection to
extend these columns all the way down.
- Repeat for the number of recordings that you need to analyze.
Note! If your baseline is longer than 5 minutes, you should ensure that you take the last 5 minutes of this recording. Otherwise, you may be misrepresenting the sections of the recording that belong in the baseline region!
- You are now ready to import your data into R! Use the
add_new_cells()function withdata_type = "sEPSC". You may find it helpful to read the Get Started guide if you are setting up your data for the first time.
FAQ
There are some noisy traces or traces with strange artifacts.
You can exclude individual traces (for example ones with lots of
noise or a very unstable baseline) in the Trace Selection box of Step
11. Select the traces you want to exclude, then Invert your
selection.
It will be difficult to accurately identify true currents in this sweep.