Plot action potential frequency curves for a single treatment
Source:R/Plot-data.R
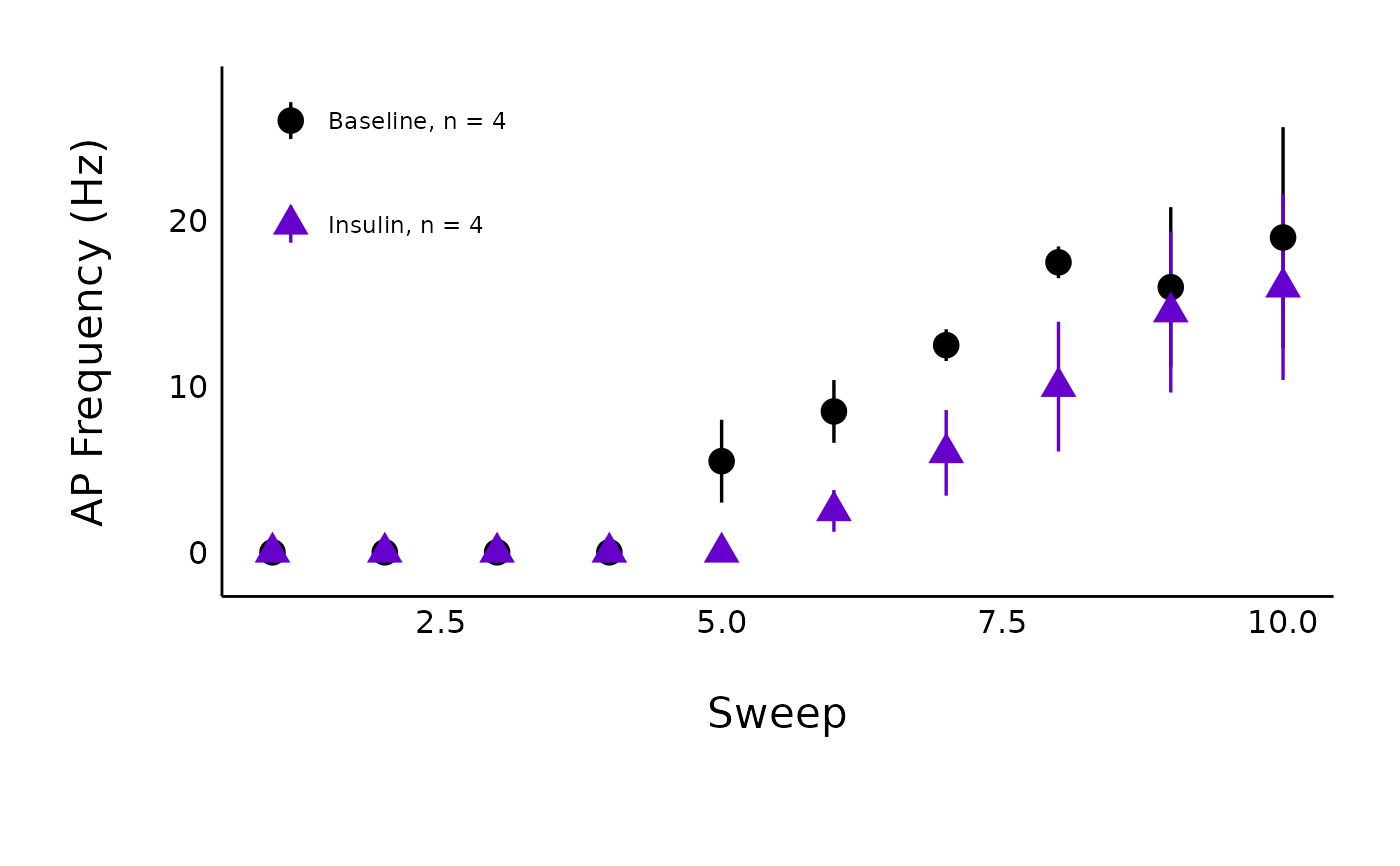
plot_AP_frequencies_single_treatment.RdThis function allows you to generate a plot of action potential frequency (y-axis) for each current injection (x-axis), coloured by state (baseline or post-hormone/treatment).
Usage
plot_AP_frequencies_single_treatment(
  data,
  plot_treatment,
  plot_category,
  included_sexes = "both",
  male_label = "Male",
  female_label = "Female",
  large_axis_text = "no",
  baseline_label = "Baseline",
  hormone_added,
  test_type,
  significance_display_method = "p-values",
  geom_signif_text_size = 5,
  geom_signif_y_spacer = 1,
  geom_signif_family = "",
  p_adjust_method = "holm",
  save_plot_png = "no",
  treatment_colour_theme,
  baseline_shape = 16,
  post_treatment_shape = 17,
  save_output_as_RDS = "no",
  theme_options,
  ggplot_theme = patchclampplotteR_theme()
)
Arguments
- data
Action potential frequency data imported through
add_new_cells()withdata_type == "AP_count"- plot_treatment
A character value specifying the treatment you would like to plot (e.g.
"Control").plot_treatmentrepresents antagonists that were present on the brain slice, or the animals were fasted, etc.- plot_category
A numeric value specifying the category, which can be used to differentiate different protocol types. In the sample dataset for this package,
plot_category == 2represents experiments where insulin was applied continuously after a 5-minute baseline period.- included_sexes
A character value (
"both","male"or"female"). Useful if you want to have a plot with data from one sex only. Defaults to"both". If you choose a single sex, the resulting plot will have"-males-only"or"-females-only"in the file name.- male_label
A character value used to describe how males are encoded in the
sexcolumn of the dataframe used indata. This MUST match the value for male data in thesexcolumn, and it must be consistent across data sheets. Defaults to"Male".- female_label
A character value used to describe how females are encoded in the
sexcolumn of the dataframe used indata. This MUST match the value for female data in thesexcolumn, and it must be consistent across data sheets. This must be consistent in all data sheets. Defaults to"Female".- large_axis_text
A character (
"yes"or"no"). If"yes", a ggplot theme layer will be applied which increases the size of the axis text.- baseline_label
A character value for the x-axis label applied to the pre-hormone state. Defaults to
"Baseline".- hormone_added
A character value that will be used as the label over the line annotating the period when a hormone was applied. Examples include
"500 nM Insulin","CCK + Leptin", and"Insulin". If you applied a high-frequency stimulation (HFS) protocol instead, write "HFS", and an annotation arrow will be added instead.- test_type
A character (must be
"wilcox.test","t.test"or"none") describing the statistical model used to create a significance bracket comparing the pre- and post-hormone groups.- significance_display_method
A character value (
"stars"or"p-value") describing how significance values should be displayed. These annotations will not appear iftest_typeis"none".)- geom_signif_text_size
A numeric value describing the size of the text annotations (significance stars or p-values) on the plot. Defaults to
5.- geom_signif_y_spacer
A numeric value describing the vertical spacing applied to the significance markers. Defaults to 1, but can be set to a higher value if the p-values or significance stars are too close to the error bars.
- geom_signif_family
A character value describing the font family used for the p-value annotations used by
ggsignif::geom_signif(). Defaults to""(empty value, will be replaced with default system font), but can be replaced with a named font. Use a package likeextrafontto load system fonts into R.- p_adjust_method
This argument is directly related to
p.adjust.methodinrstatix::t_test. This is the method used to adjust the p-value in multiple pairwise comparisons. Allowed values include"holm","hochberg","hommel","bonferroni","BH","BY","fdr","none"(although"none"is not recommended).- save_plot_png
A character (
"yes"or"no"). If"yes", the plot will be saved as a .png usingggsave(). The filepath depends on the current type, but they will all go in subfolders belowFigures/in your project directory.- treatment_colour_theme
A dataframe containing treatment names and their associated colours as hex values. See sample_treatment_names_and_colours for an example of what this dataframe should look like.
- baseline_shape
A numeric value describing the shape used for the baseline data. Defaults to
16, which is a circle.- post_treatment_shape
A numeric value describing the shape used for the post-treatment/post-protocol data. Defaults to
17, which is a triangle.- save_output_as_RDS
A character (
"yes"or"no") describing if the resulting object should be saved as an RDS file in the folder"Data/Output-Data-from-R". The function will automatically create this folder if it doesn't already exist.- theme_options
A dataframe containing theme options. See sample_theme_options for an example of what this dataframe should look like.
- ggplot_theme
The name of a ggplot theme or your custom theme. This will be added as a layer to a ggplot object. The default is
patchclampplotteR_theme(), but other valid entries includetheme_bw(),theme_classic()or the name of a custom ggplot theme stored as an object.
Value
A ggplot object. If save_plot_png == "yes", it will also generate
a .png file in the folder Figures/Action-potentials relative to the
project directory, with the treatment and category included in the filename.
References
Nutter B (2018). lazyWeave: LaTeX Wrappers for R #' Users. R package version 3.0.2, https://CRAN.R-project.org/package=lazyWeave.
Examples
plot_AP_frequencies_single_treatment(
  data = sample_AP_count_data,
  plot_treatment = "Control",
  plot_category = 2,
  baseline_label = "Baseline",
  hormone_added = "Insulin",
  included_sexes = "both",
  significance_display_method = "stars",
  treatment_colour_theme = sample_treatment_names_and_colours,
  large_axis_text = "no",
  test_type = "wilcox.test",
  p_adjust_method = "holm",
  theme_options = sample_theme_options,
  save_plot_png = "no"
)