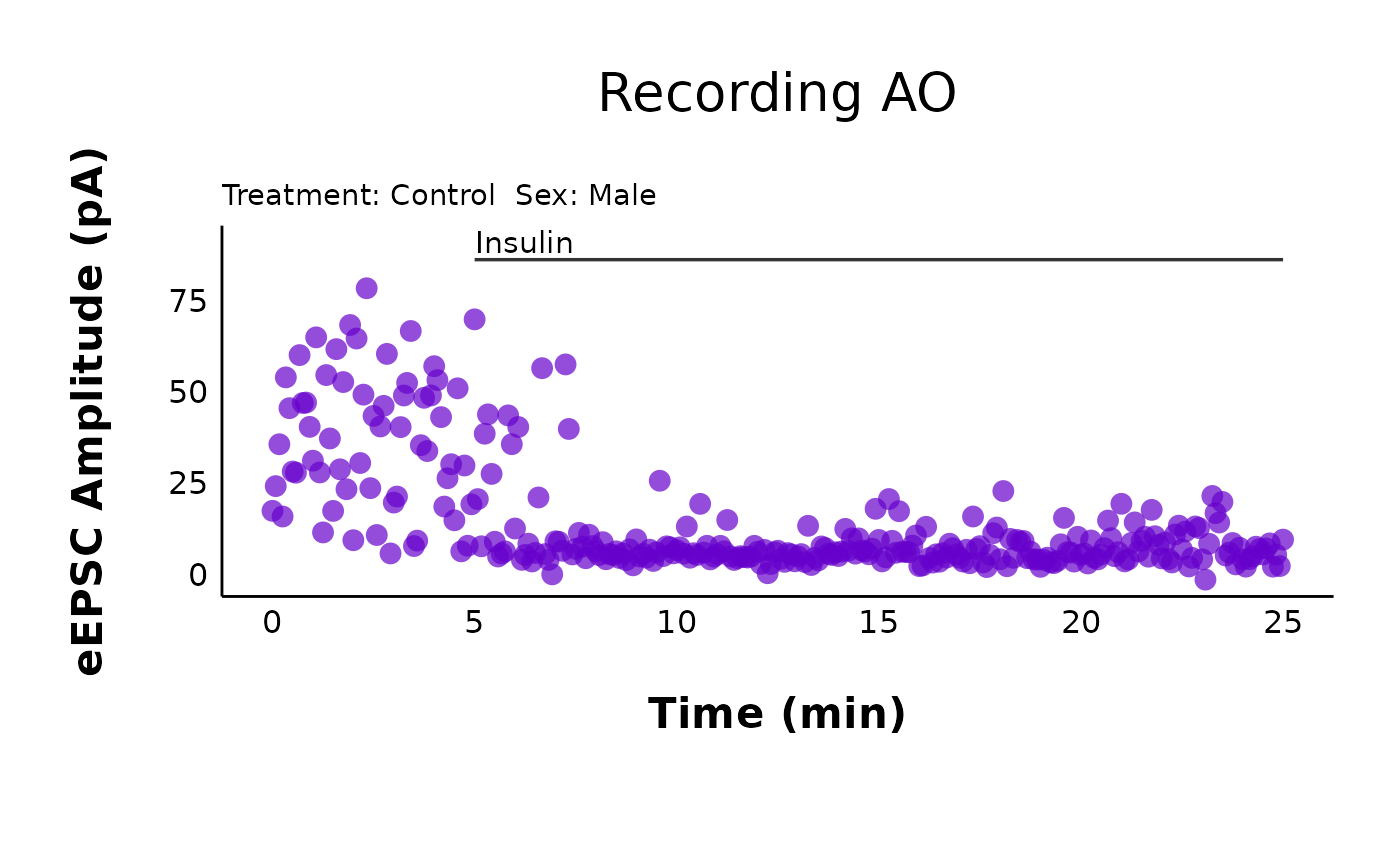
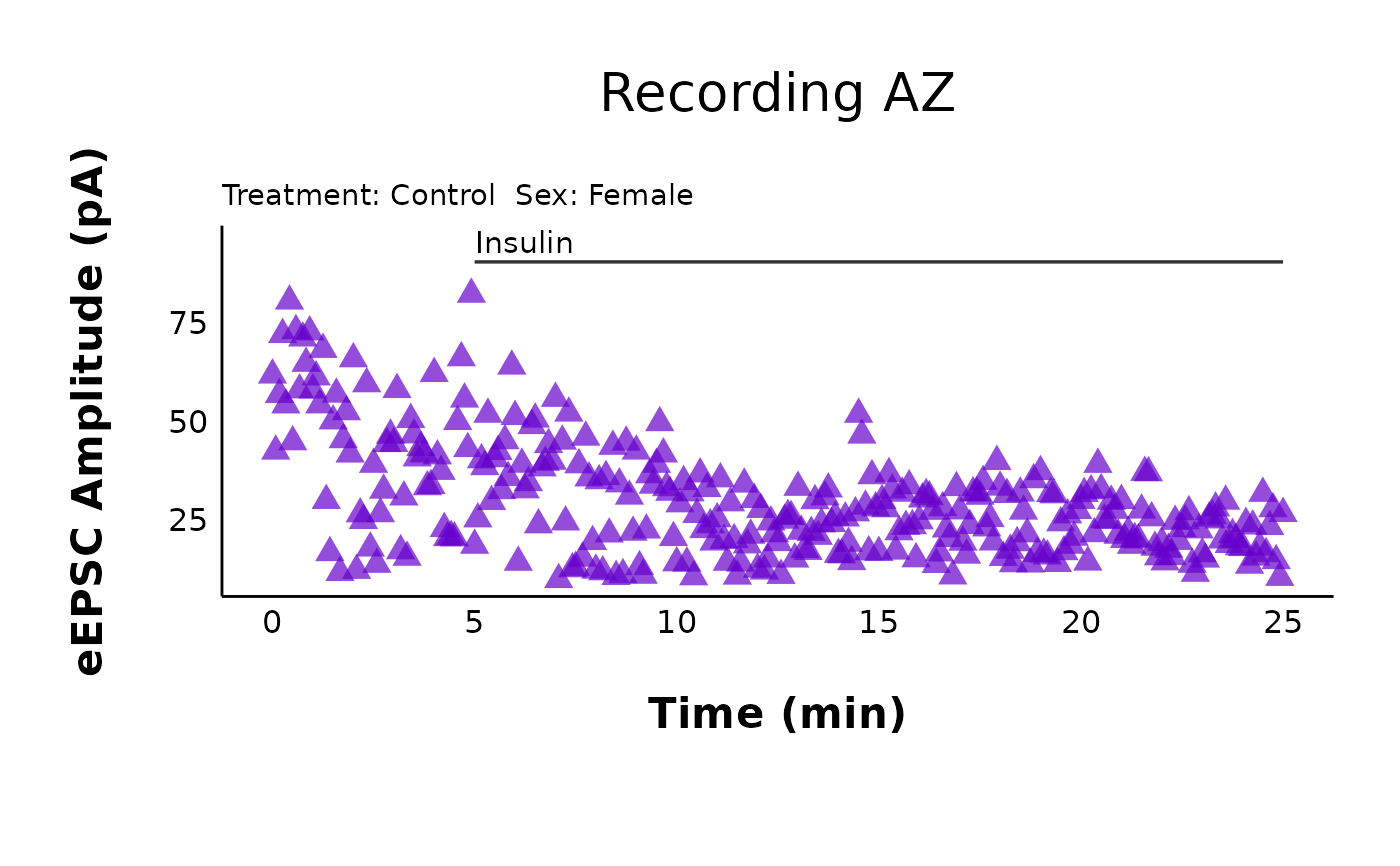
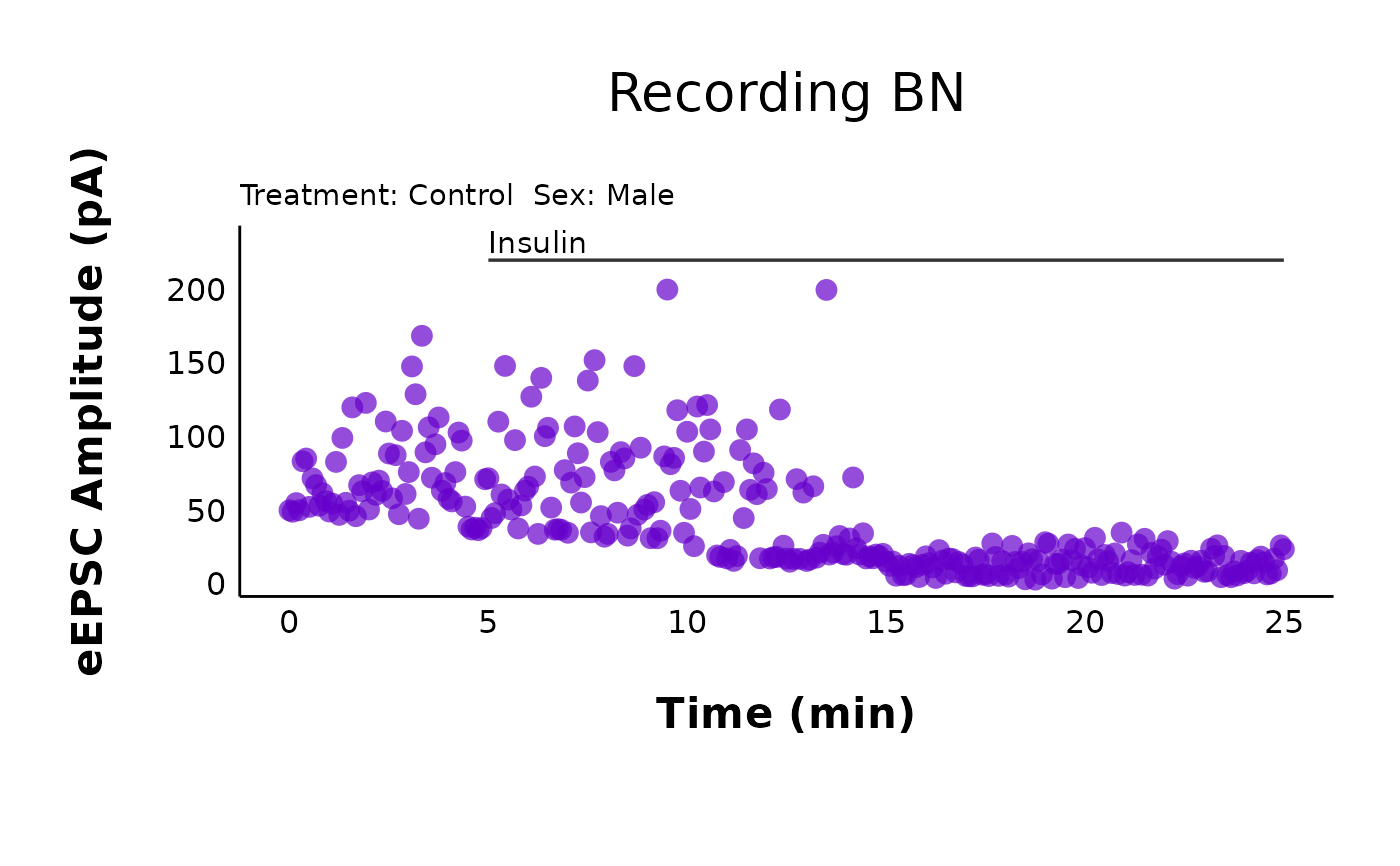
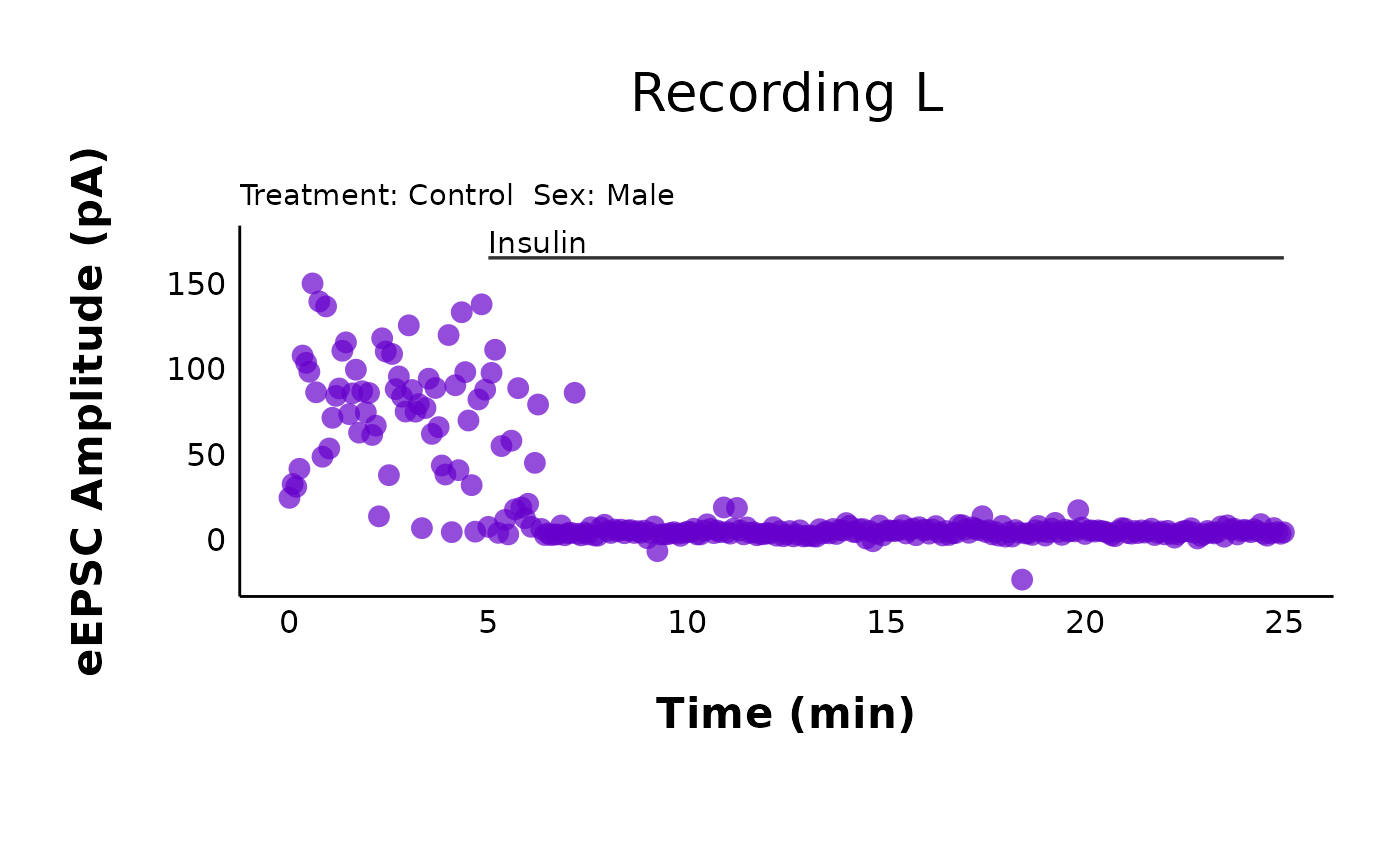
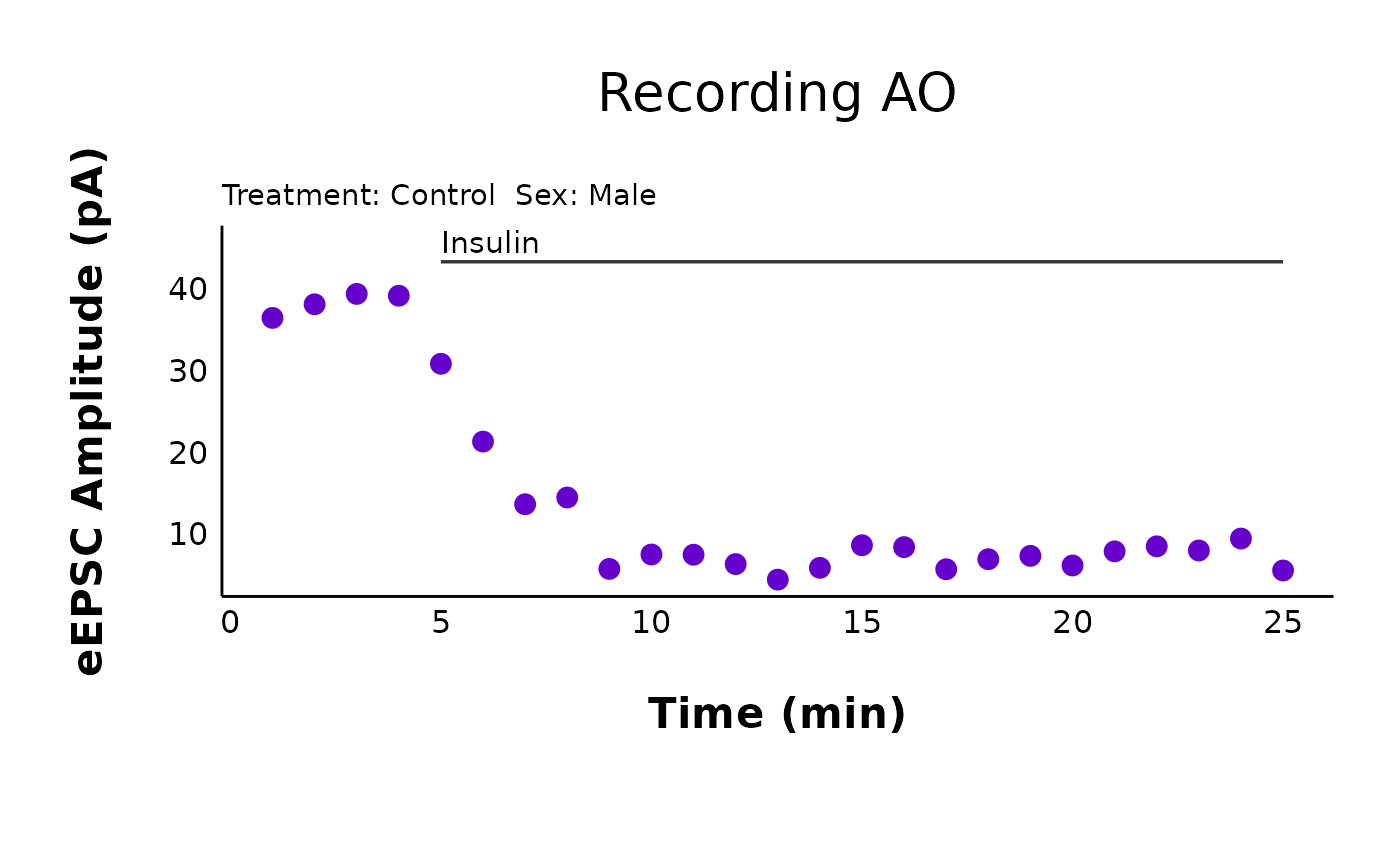
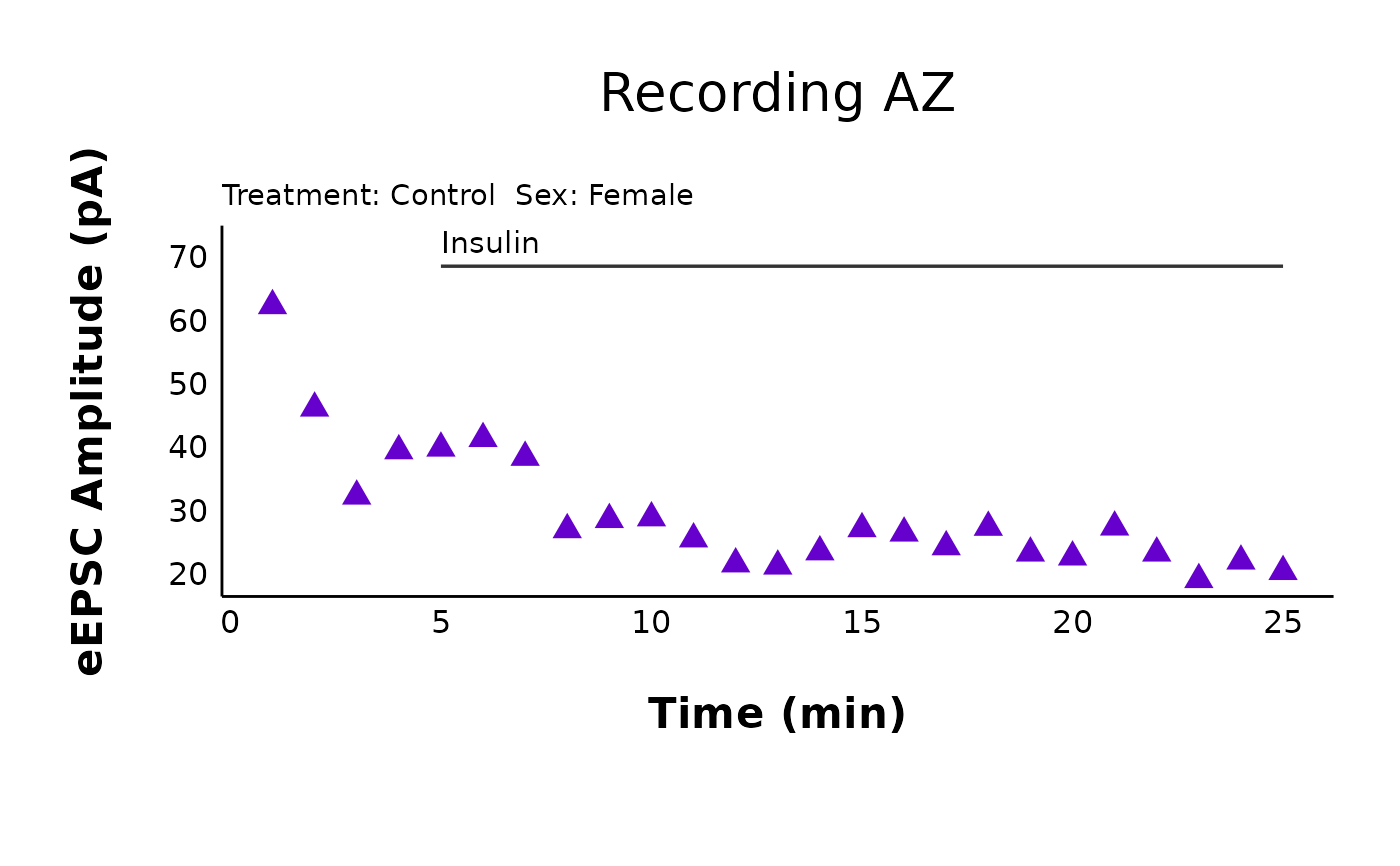
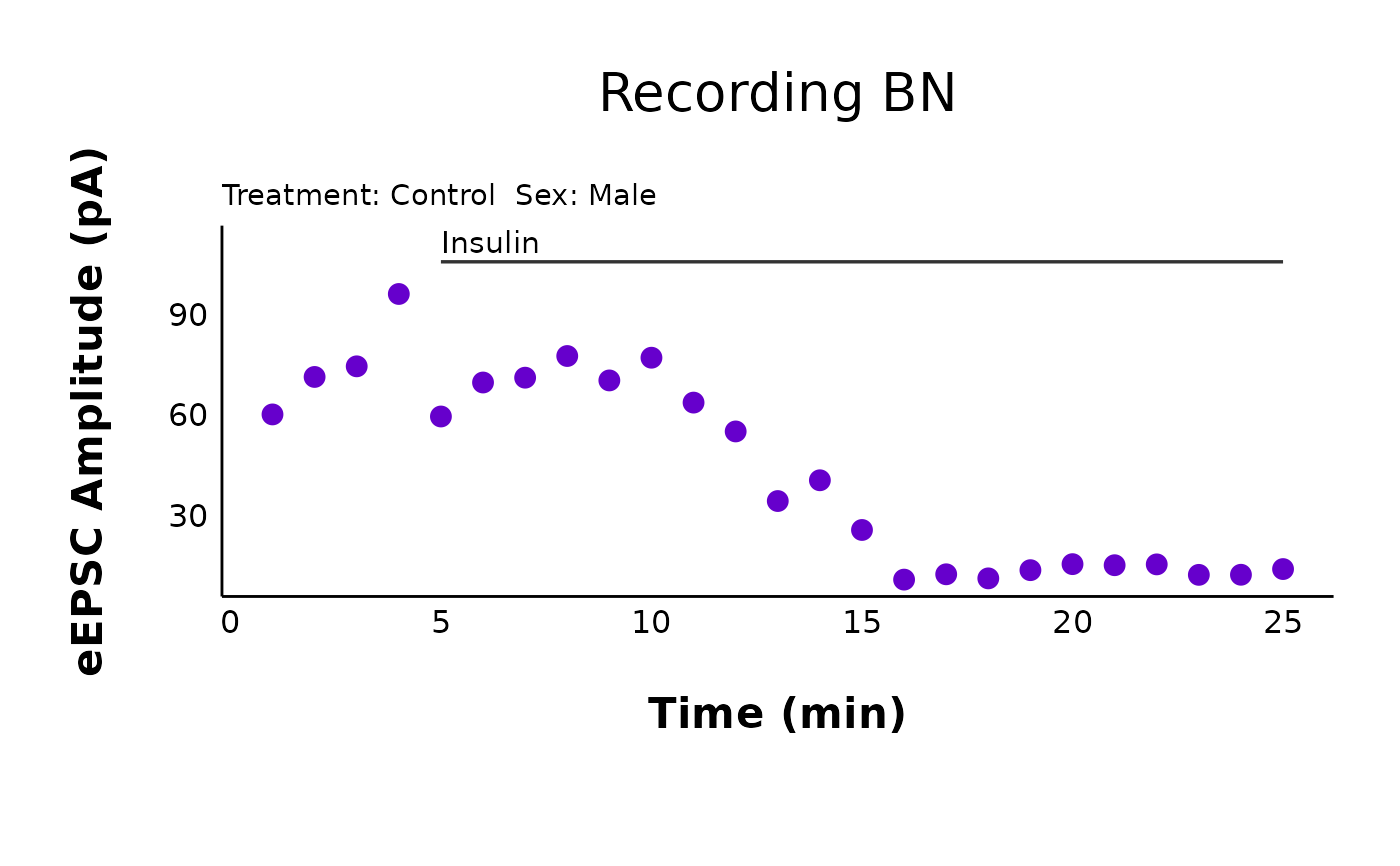
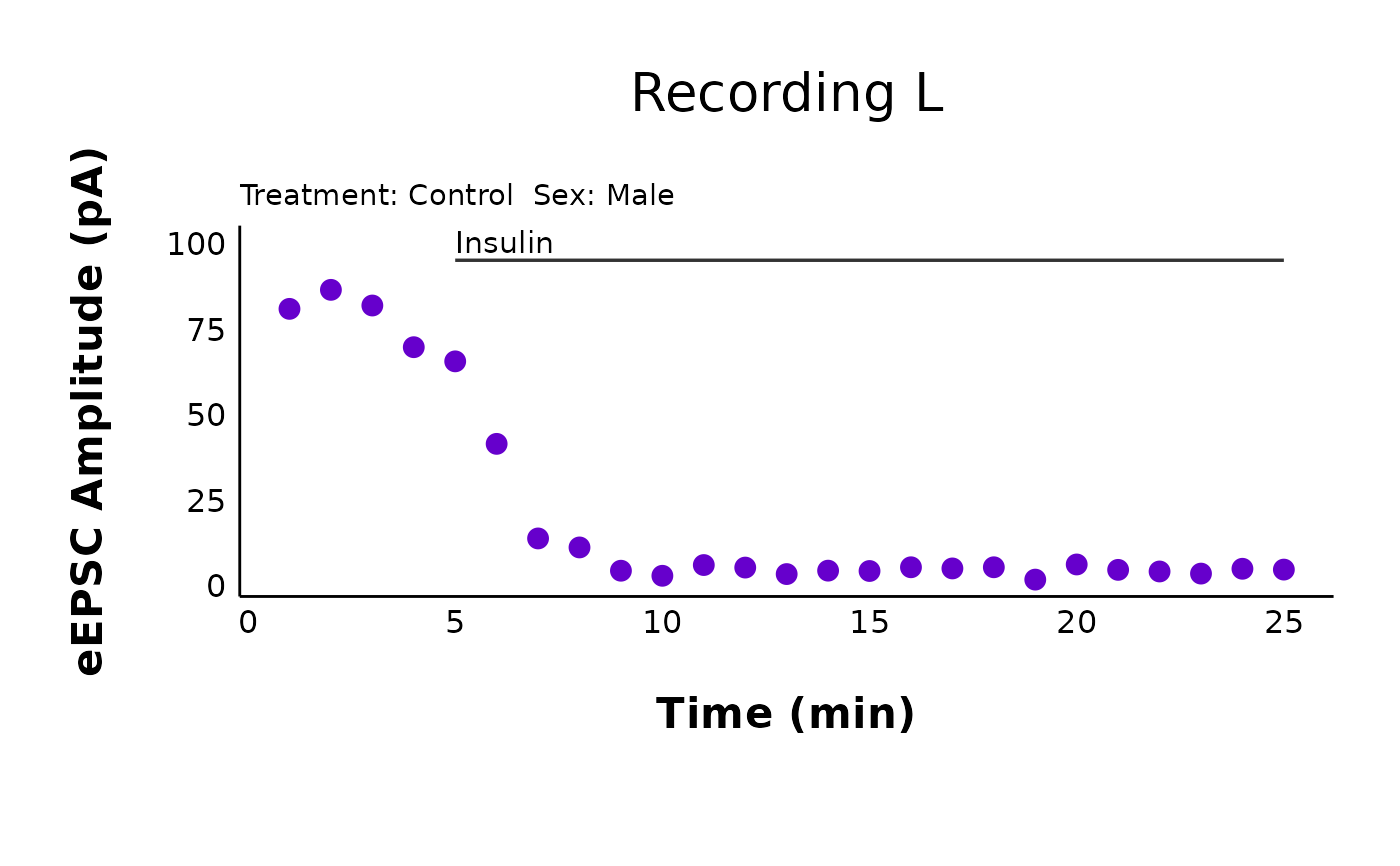
This function enables you to create a scatterplot of raw evoked (or
spontaneous) current amplitude over time in minutes. The plot title will be
pulled from the recording ID (the letter column in the raw data), and the
subtitle will include the sex and treatment. The plot will also contain a
horizontal line annotation displayed over the time region where a hormone was
applied. If a high-frequency stimulation (HFS) protocol is used, the plot
will display an arrow with the label "HFS" to indicate the time when HFS was
applied.
Usage
plot_raw_current_data(
  data,
  plot_treatment = "Control",
  plot_category = 2,
  current_type = "eEPSC",
  y_variable = "P1",
  pruned = "no",
  hormone_added = "Insulin",
  hormone_or_HFS_start_time = 5,
  hormone_end_time = NULL,
  theme_options,
  male_label = "Male",
  female_label = "Female",
  colour_by_sex = "yes",
  software = "Clampfit",
  x_label = "Time (min)",
  treatment_colour_theme,
  geom_text_family = "",
  filename_suffix = "",
  save_plot_png = "no",
  ggplot_theme = patchclampplotteR_theme()
)
Arguments
- data
A dataframe containing the raw evoked current data generated from
make_normalized_EPSC_data(). Ifpruned = "yes"you must use the$individual_cellscomponent of a pruned dataset.- plot_treatment
A character value specifying the treatment you would like to plot (e.g.
"Control").plot_treatmentrepresents antagonists that were present on the brain slice, or the animals were fasted, etc.- plot_category
A numeric value specifying the category, which can be used to differentiate different protocol types. In the sample dataset for this package,
plot_category == 2represents experiments where insulin was applied continuously after a 5-minute baseline period.- current_type
A character describing the current type. Allowed values are
"eEPSC"or"sEPSC".- y_variable
A character value specifying the variable to be plotted on the y-axis. For evoked currents (
current_type = "eEPSC"), the available y_variables are"P1","P1_transformed","mean_P1"and"PPR". Note: If you select"mean_P1", you must set theprunedargument to"yes". For spontaneous currents (current_type = "sEPSC"), the available y_variables are"amplitude"or"frequency". NOTE:"frequency"is only available ifpruned = "yes".- pruned
A character value (
"yes"or"no") specifying if the data are pruned. The plot will then present the data as means with error bars. This is only relevant for y variables likemean_P1forcurrent_type = "eEPSC".- hormone_added
A character value that will be used as the label over the line annotating the period when a hormone was applied. Examples include
"500 nM Insulin","CCK + Leptin", and"Insulin". If you applied a high-frequency stimulation (HFS) protocol instead, write "HFS", and an annotation arrow will be added instead.- hormone_or_HFS_start_time
A numeric value indicating the time (in minutes) when a hormone was added or when HFS was applied. This will set the annotation line start point. This can also be set to
NULLif you want to create your own more complex annotations (for example, for washout, or multiple hormones added at different times). To add your own annotations, useggplot2::annotate(geom = "segment")as a starting point.- hormone_end_time
A numeric value indicating the time (in minutes) when a hormone stopped being applied, such as for a washout experiment.
- theme_options
A dataframe containing theme options. See sample_theme_options for an example of what this dataframe should look like.
- male_label
A character value used to describe how males are encoded in the
sexcolumn of the dataframe used indata. This MUST match the value for male data in thesexcolumn, and it must be consistent across data sheets. Defaults to"Male".- female_label
A character value used to describe how females are encoded in the
sexcolumn of the dataframe used indata. This MUST match the value for female data in thesexcolumn, and it must be consistent across data sheets. This must be consistent in all data sheets. Defaults to"Female".- colour_by_sex
A character ("yes" or "no") describing if the colour should change based on sex. If "yes", the male data will be coloured according to the
colourscolumn oftreatment_colour_theme, and female data will be coloured according to thevery_pale_colourscolumn oftreatment_colour_theme. If "no", all plots will be coloured using thecolourscolumn.- software
A character (
"Clampfit"or"MiniAnalysis") describing what software tool was used to analyze the data innew_raw_data_csv. This is relevant whendata_typeis"sEPSC"because the exported data is different. Defaults to"Clampfit".- x_label
A character value specifying the x-axis label. Defaults to "Time (min)".
- treatment_colour_theme
A dataframe containing treatment names and their associated colours as hex values. See sample_treatment_names_and_colours for an example of what this dataframe should look like.
- geom_text_family
A character value describing the font family used for the scale bar annotations. Defaults to
""(empty, will use default system font), but can be replaced with a named font. Use a package likeextrafontto load system fonts into R.- filename_suffix
Optional character value to add a suffix to the filename of the .png file created with this plot. Could be useful if you want to specify anything about the data (for example, to distinguish between recordings produced in MiniAnalysis vs. Clampfit).
- save_plot_png
A character (
"yes"or"no"). If"yes", the plot will be saved as a .png using ggsave. The filepath depends on the current type, but they will all go in subfolders belowFigures/in your project directory.- ggplot_theme
The name of a ggplot theme or your custom theme. This will be added as a layer to a ggplot object. The default is
patchclampplotteR_theme(), but other valid entries includetheme_bw(),theme_classic()or the name of a custom ggplot theme stored as an object.
Value
A list of ggplot objects, where each list element is a scatterplot
of one recording. If save_plot_png == "yes", it will also generate a .png
file from each ggplot element in the list. The figures will be exported to
Figures/Evoked-currents/Output-individual-plots or
Figures/Spontaneous-currents/Output-individual-plots, depending on the
current_type. The .png filename will contain the letter. If the data
are pruned, the filename will also include _pruned in the filename. If
the data are normalized (y_variable == "P1_transformed), the title will
include _normalized in the filename. Example filenames include "A.png",
"A_normalized", and "A_pruned.png".
Examples
# Plot raw data
plot_raw_current_data(
data = sample_raw_eEPSC_df,
plot_treatment = "Control",
plot_category = 2,
current_type = "eEPSC",
y_variable = "P1",
pruned = "no",
hormone_added = "Insulin",
hormone_or_HFS_start_time = 5,
theme_options = sample_theme_options,
treatment_colour_theme = sample_treatment_names_and_colours,
save_plot_png = "no"
)
#> $AO
 #>
#> $AZ
#>
#> $AZ
 #>
#> $BN
#>
#> $BN
 #>
#> $L
#>
#> $L
 #>
# Plot pruned data
# Note that this requires the third element of the list generated with `make_pruned_EPSC_data()`.
plot_raw_current_data(
data = sample_pruned_eEPSC_df$individual_cells,
plot_treatment = "Control",
plot_category = 2,
current_type = "eEPSC",
y_variable = "mean_P1",
pruned = "yes",
hormone_added = "Insulin",
hormone_or_HFS_start_time = 5,
theme_options = sample_theme_options,
treatment_colour_theme = sample_treatment_names_and_colours
)
#> $AO
#>
# Plot pruned data
# Note that this requires the third element of the list generated with `make_pruned_EPSC_data()`.
plot_raw_current_data(
data = sample_pruned_eEPSC_df$individual_cells,
plot_treatment = "Control",
plot_category = 2,
current_type = "eEPSC",
y_variable = "mean_P1",
pruned = "yes",
hormone_added = "Insulin",
hormone_or_HFS_start_time = 5,
theme_options = sample_theme_options,
treatment_colour_theme = sample_treatment_names_and_colours
)
#> $AO
 #>
#> $AZ
#>
#> $AZ
 #>
#> $BN
#>
#> $BN
 #>
#> $L
#>
#> $L
 #>
#>
