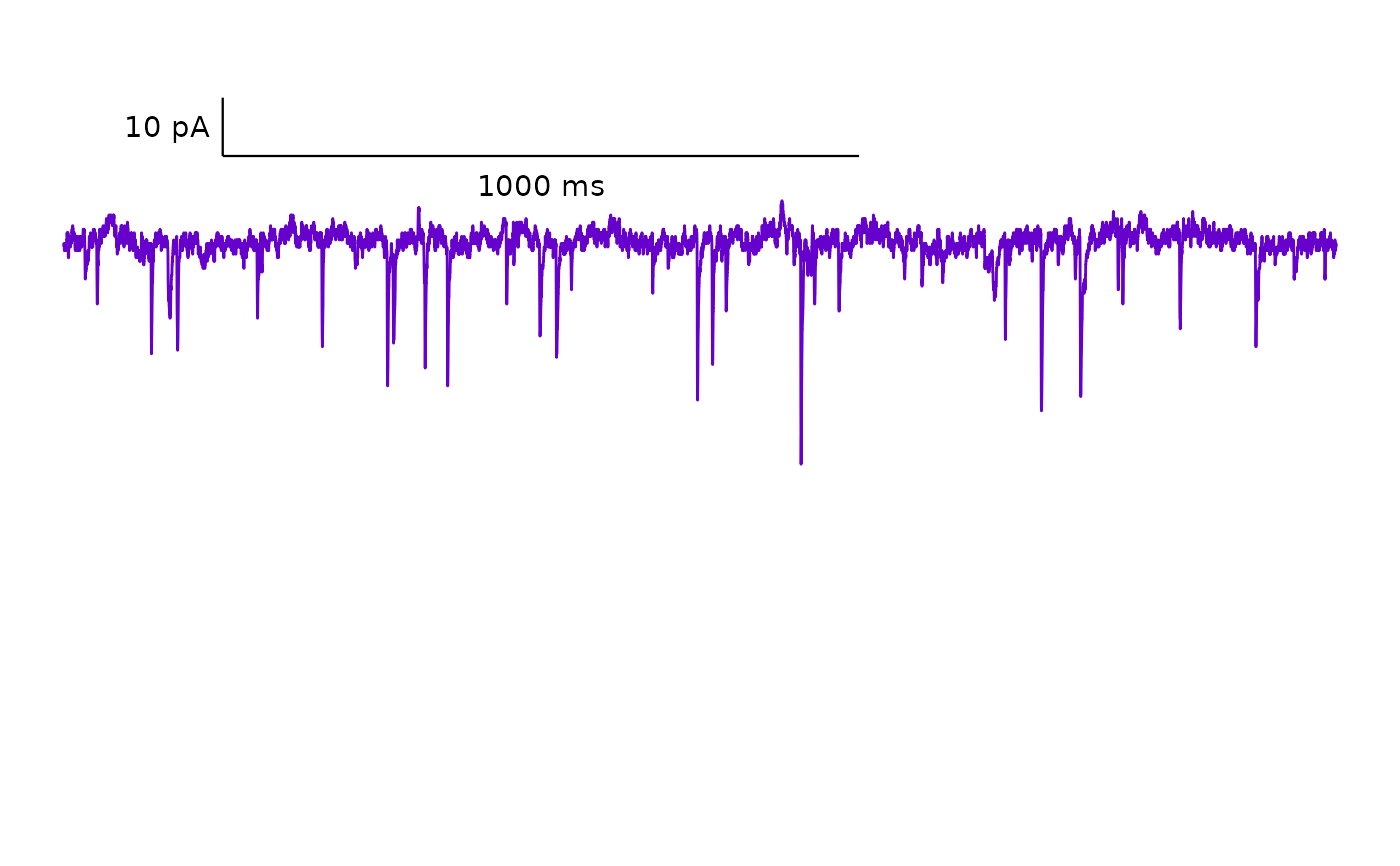
Plot a representative spontaneous current trace
Source:R/Plot-data.R
plot_spontaneous_current_trace.Rdplot_spontaneous_current_trace() generates a plot of raw current amplitude
over time for a specified sweep from an ABF file. It requires a dataframe
generated from raw .abf data with import_ABF_file(). The function returns a
ggplot object with an optional scale bar.
Usage
plot_spontaneous_current_trace(
  data,
  plot_colour = "#000000",
  plot_category,
  plot_treatment,
  sex,
  state,
  letter,
  include_scale_bar = "yes",
  include_scale_bar_label = "yes",
  scale_bar_label_size = 4,
  trace_annotation = "",
  trace_annotation_x_position = 1,
  trace_annotation_y_position = 6,
  geom_text_family = "",
  geom_text_colour = "#000000",
  geom_text_size = 5,
  plot_episode = "epi1",
  trace_thickness = 0.8,
  scale_bar_x_start = 2.8,
  scale_bar_x_length = 0.2,
  scale_bar_y_length = 20,
  scale_bar_y_start = -30,
  scale_bar_linewidth = 0.75,
  scale_bar_label_y_nudge = 1.5,
  plot_x_min = 1,
  plot_x_max = 3,
  plot_y_min = -60,
  plot_y_max = 15,
  filename_suffix = "",
  save_plot_png = "no",
  ggplot_theme = patchclampplotteR_theme()
)
Arguments
- data
A dataframe containing at least these columns:
time,episode,current,voltage,time_sec. An easy way to obtain this is by importing a raw .abf file through theimport_ABF_file()function.- plot_colour
A character value naming the colour of the plot.
- plot_category
A numeric value specifying the category, which can be used to differentiate different protocol types. In the sample dataset for this package,
plot_category == 2represents experiments where insulin was applied continuously after a 5-minute baseline period.- plot_treatment
A character value specifying the treatment you would like to plot (e.g.
"Control").plot_treatmentrepresents antagonists that were present on the brain slice, or the animals were fasted, etc.- sex
An optional character value (
"male"or"female"), which will be added to the file name.- state
A character value describing if the recording was taken during the baseline period or post-treatment/protocol. Examples include
"Baseline","Post-insulin". Thestatewill be included in the .png filename ifsave_plot_png = "yes".- letter
An optional character value describing the recording letter ID, (e.g.
"A","AB") that will be appended to the filename.- include_scale_bar
A character value that determines if a scale bar will be added to the plot. Allowed values are
"yes"and"no".- include_scale_bar_label
A character value (
"yes"or"no") describing whether to include text labels on the scale bar. If"yes", the text annotation values will be pulled fromscale_bar_x_lengthandscale_bar_y_length.- scale_bar_label_size
A numeric value describing the size of the scale bar annotation text. Defaults to 4.
- trace_annotation
A character value (e.g.
"Baseline") that will be added as text on the plot. Useful for labelling traces for publications and presentations. Defaults to"Baseline".- trace_annotation_x_position
A numeric value for the location of the
trace_annotationon the x-axis. Defaults to1.- trace_annotation_y_position
A numeric value for the location of the
trace_annotationon the y-axis. Defaults to6.- geom_text_family
A character value describing the font family used for the scale bar annotations. Defaults to
""(empty, will use default system font), but can be replaced with a named font. Use a package likeextrafontto load system fonts into R.- geom_text_colour
A character value describing the colour of the
trace_annotationtext. Defaults to"#000000".- geom_text_size
A numeric value describing the size of the
trace_annotationtext. Defaults to5.- plot_episode
A character value describing the sweep (e.g.
epi1) that will be used for the plot.- trace_thickness
A numeric value describing the thickness of the line.
- scale_bar_x_start
A numeric value (in seconds) describing the x-axis position of the scale bar (default is
1.25).- scale_bar_x_length
A numeric value describing the horizontal span (in seconds) of the scale bar. This will automatically be converted and displayed in milliseconds (default is
0.5).- scale_bar_y_length
A numeric value describing the vertical span (in pA) of the scale bar (default is
20).- scale_bar_y_start
A numeric value describing the y-axis position (in pA) of the scale bar (default is
15).- scale_bar_linewidth
A numeric value describing the thickness of the scalebar line (default is
0.4).- scale_bar_label_y_nudge
An optional numeric value that will add additional padding between the scale bar x-axis label and the scale bar. Defaults to
1.5.- plot_x_min
A numeric value describing the minimum value on the x-axis (in seconds). Defaults to
1.- plot_x_max
A numeric value describing the maximum value on the x-axis (in seconds). Defaults to
3.- plot_y_min
A numeric value describing the minimum value on the y-axis (in pA). Defaults to
-80. !!Warning!! Be sure to check your raw current amplitudes and adjust this to avoid cutting off data!!- plot_y_max
A numeric value describing the maximum value on the y-axis (in pA). Defaults to
5. !!Warning!! Be sure to check your raw current amplitudes and adjust this to avoid cutting off data!!- filename_suffix
Optional character value to add a suffix to the filename of the .png file created with this plot. Could be useful if you have specified a custom list of treatments.
- save_plot_png
A character (
"yes"or"no"). If"yes", the plot will be saved as a .png usingggsave(). The filepath depends on the current type, but they will all go in subfolders belowFigures/in your project directory.- ggplot_theme
The name of a ggplot theme or your custom theme. This will be added as a layer to a ggplot object. The default is
patchclampplotteR_theme(), but other valid entries includetheme_bw(),theme_classic()or the name of a custom ggplot theme stored as an object.
Value
A ggplot object. If save_plot_png is defined as "yes", it will also
generate a .png file in the folder
Figures/Spontaneous-currents/Representative-Traces relative to the
project directory, with the plot_category, plot_treatment, and state included in the filename.