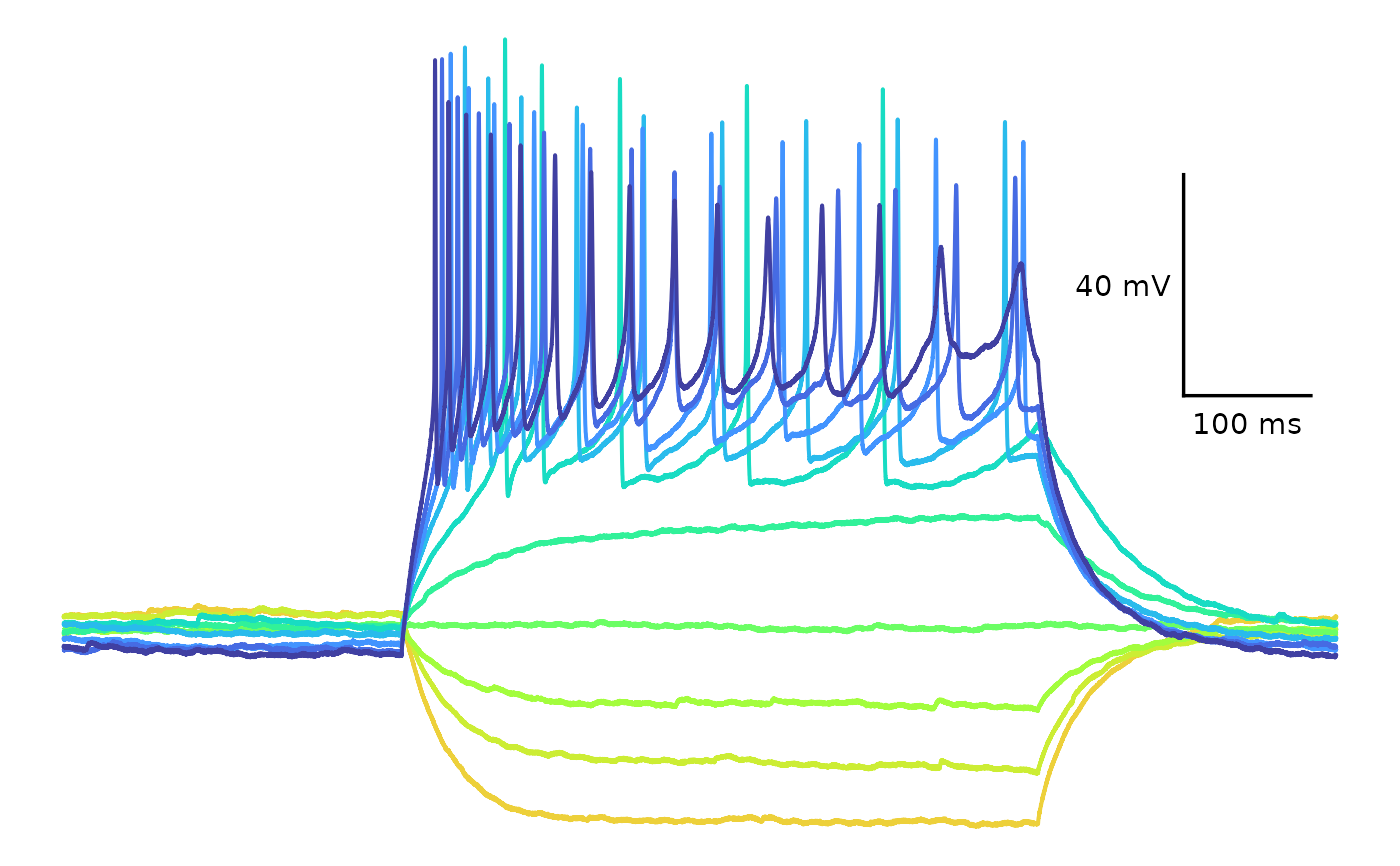
This is an excerpt of a raw recording of action potentials imported as a dataframe using import_ABF_file(). It is used to demonstrate the
plot_AP_trace() function.
Format
A dataframe of 100000 objects of 5 variables.
- episode
A factor representing the sweep, such as "epi1".
- time_sec
Time in seconds.
- time
Time in ms*100.
- voltage
Numeric value representing voltage in mV.
- current
Numeric value representing current amplitude in pA.
Details
This is a current injection protocol taken during the baseline period. See sample_ap_abf_insulin for data from the same protocol taken after 25 minutes of exposure to 500 nM insulin.
Examples
plot_AP_trace(
  data = sample_ap_abf_baseline,
  sweeps = as.character(unique(sample_ap_abf_baseline$episode)),
  custom_scale_colours = c(
    "#edd03a", "#cced34",
    "#a3fd3d", "#6bfe64",
    "#31f199", "#18dcc3",
    "#29bbec", "#4294ff",
    "#466be3", "#4040a2"
  ),
  colour_scale_option = "custom",
  plot_category = 2,
  plot_treatment = "Control"
)