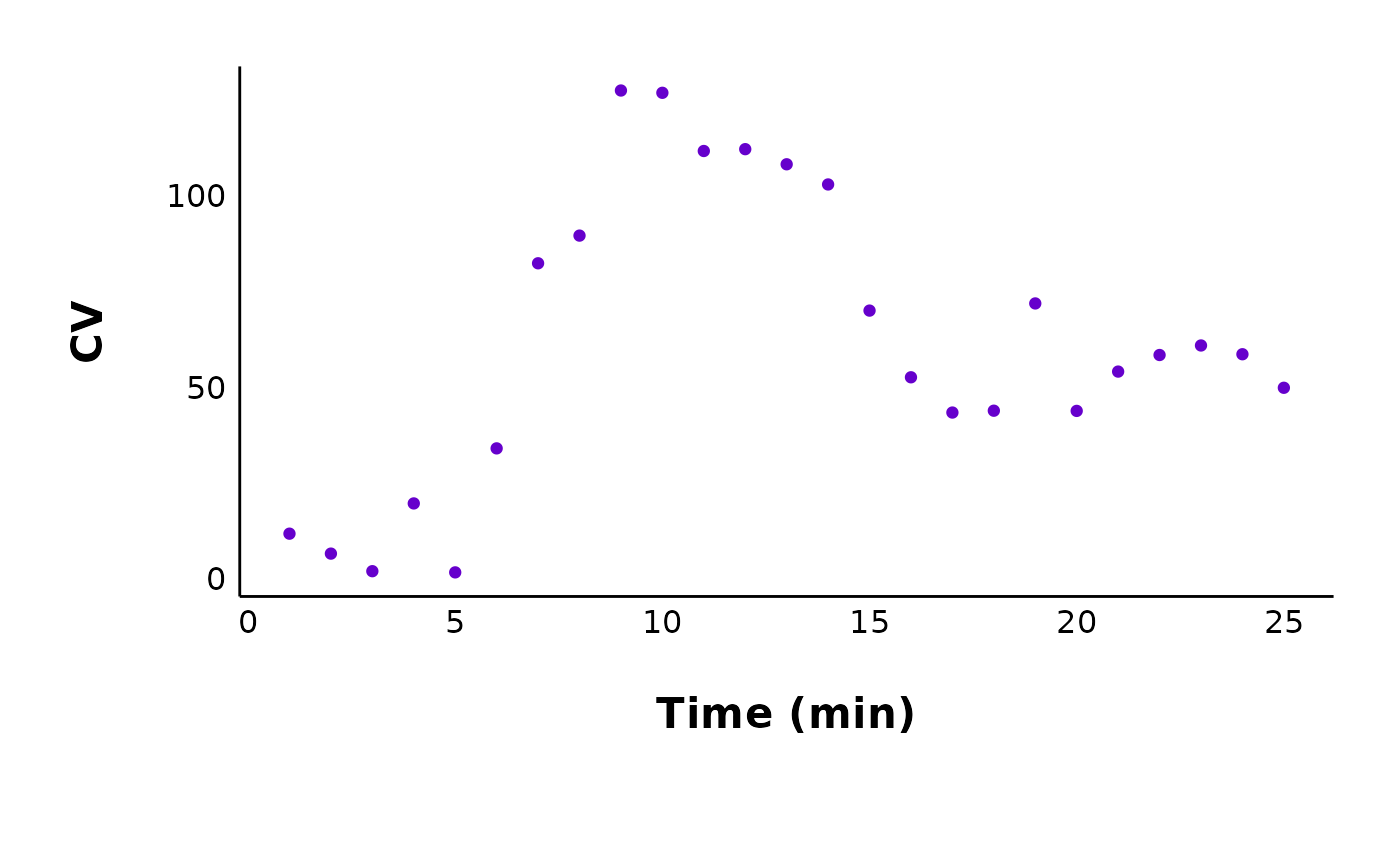
plot_cv_data() enables you to save a plot of the coefficient of variation
in evoked current amplitudes over time.
Usage
plot_cv_data(
  data,
  plot_treatment = "Control",
  plot_category,
  treatment_colour_theme,
  included_sexes = "both",
  male_label = "Male",
  female_label = "Female",
  x_label = "Time (min)",
  theme_options,
  save_plot_png = "no",
  filename_suffix = "",
  ggplot_theme = patchclampplotteR_theme()
)
Arguments
- data
A dataframe of the pruned current data for all cells. This is the third dataframe in the list generated from
make_pruned_EPSC_data().- plot_treatment
A character value specifying the treatment you would like to plot (e.g.
"Control").plot_treatmentrepresents antagonists that were present on the brain slice, or the animals were fasted, etc.- plot_category
A numeric value specifying the category, which can be used to differentiate different protocol types. In the sample dataset for this package,
plot_category == 2represents experiments where insulin was applied continuously after a 5-minute baseline period.- treatment_colour_theme
A dataframe containing treatment names and their associated colours as hex values. See sample_treatment_names_and_colours for an example of what this dataframe should look like.
- included_sexes
A character value (
"both","male"or"female"). Useful if you want to have a plot with data from one sex only. Defaults to"both". If you choose a single sex, the resulting plot will have"-males-only"or"-females-only"in the file name.- male_label
A character value used to describe how males are encoded in the
sexcolumn of the dataframe used indata. This MUST match the value for male data in thesexcolumn, and it must be consistent across data sheets. Defaults to"Male".- female_label
A character value used to describe how females are encoded in the
sexcolumn of the dataframe used indata. This MUST match the value for female data in thesexcolumn, and it must be consistent across data sheets. This must be consistent in all data sheets. Defaults to"Female".- x_label
A character value specifying the x-axis label. Defaults to "Time (min)".
- theme_options
A dataframe containing theme options. See sample_theme_options for an example of what this dataframe should look like.
- save_plot_png
A character (
"yes"or"no"). If"yes", the plot will be saved as a .png using ggsave. The filepath depends on the current type, but they will all go in subfolders belowFigures/in your project directory.- filename_suffix
Optional character value to add a suffix to the filename of the .png file created with this plot. Could be useful if you want to specify anything about the data (for example, to distinguish between recordings produced in MiniAnalysis vs. Clampfit).
- ggplot_theme
The name of a ggplot theme or your custom theme. This will be added as a layer to a ggplot object. The default is
patchclampplotteR_theme(), but other valid entries includetheme_bw(),theme_classic()or the name of a custom ggplot theme stored as an object.
Value
A ggplot object. If save_plot_png == "yes" it will also generate a
.png file in the folder Figures/Evoked-currents/CV relative to the
project directory. The treatment will be included with the filename.
See also
plot_variance_comparison_data() to make plots of inverse
coefficient of variation squared and VMR, which are useful to determine if
a mechanism is pre- or post-synaptic.
Examples
plot_cv_data(
  data = sample_pruned_eEPSC_df$all_cells,
  plot_treatment = "Control",
  plot_category = 2,
  theme_options = sample_theme_options,
  included_sexes = "both",
  treatment_colour_theme = sample_treatment_names_and_colours,
  save_plot_png = "no"
)
#> Warning: Removed 25 rows containing missing values or values outside the scale range
#> (`geom_point()`).