This function enables you to create a scatterplot of mean evoked (or spontaneous) current amplitude over over time in minutes. The data are summarized by treatment and sex, and averaged per minute. The data are presented as mean +/- the standard error.
Usage
plot_summary_current_data(
  data,
  plot_category = 2,
  plot_treatment = "Control",
  current_type = "eEPSC",
  y_variable = "amplitude",
  hormone_added = "Insulin",
  hormone_or_HFS_start_time = 5,
  hormone_end_time = NULL,
  legend_position = "right",
  legend_position_inside = c(0.13, 0.15),
  included_sexes = "both",
  male_label = "Male",
  female_label = "Female",
  include_sex_in_legend = "yes",
  include_representative_trace = "no",
  representative_trace_filename = NULL,
  position_dodge_size = 0,
  annotation_x_min = 1,
  annotation_x_max = 8,
  annotation_y_min = 0,
  annotation_y_max = 40,
  y_axis_limit,
  x_label = "Time (min)",
  signif_stars = "no",
  significance_display_method = "stars",
  geom_signif_text_size = 5,
  geom_signif_family = "",
  t_test_df = NULL,
  t_test_df_male = NULL,
  t_test_df_female = NULL,
  stars_position = NULL,
  stars_position_male = NULL,
  stars_position_female = NULL,
  stars_colour = "black",
  stars_colour_male = "black",
  stars_colour_female = "black",
  large_axis_text = "no",
  shade_intervals = "no",
  theme_options,
  treatment_colour_theme,
  save_plot_png = "no",
  filename_suffix = "",
  ggplot_theme = patchclampplotteR_theme()
)
Arguments
- data
A dataframe containing pruned summary data for all cells. This is the third element of the list generated from
make_pruned_EPSC_data().- plot_category
A numeric value specifying the category, which can be used to differentiate different protocol types. In the sample dataset for this package,
plot_category == 2represents experiments where insulin was applied continuously after a 5-minute baseline period.- plot_treatment
A character value specifying the treatment you would like to plot (e.g.
"Control").plot_treatmentrepresents antagonists that were present on the brain slice, or the animals were fasted, etc.- current_type
A character describing the current type. Allowed values are
"eEPSC"or"sEPSC".- y_variable
A character value specifying the variable to be plotted on the y-axis. For evoked currents (
current_type = "eEPSC"), the available y_variables are"P1","P1_transformed","mean_P1"and"PPR". Note: If you select"mean_P1", you must set theprunedargument to"yes". For spontaneous currents (current_type = "sEPSC"), the available y_variables are"amplitude"or"frequency". NOTE:"frequency"is only available ifpruned = "yes".- hormone_added
A character value that will be used as the label over the line annotating the period when a hormone was applied. Examples include
"500 nM Insulin","CCK + Leptin", and"Insulin". If you applied a high-frequency stimulation (HFS) protocol instead, write "HFS", and an annotation arrow will be added instead.- hormone_or_HFS_start_time
A numeric value indicating the time (in minutes) when a hormone was added or when HFS was applied. This will set the annotation line start point. This can also be set to
NULLif you want to create your own more complex annotations (for example, for washout, or multiple hormones added at different times). To add your own annotations, useggplot2::annotate(geom = "segment")as a starting point.- hormone_end_time
A numeric value indicating the time (in minutes) when a hormone stopped being applied, such as for a washout experiment.
- legend_position
A character value (
"left","right","top","bottom","inside") which describes the location of the legend. If you set this to"inside", you may need to adjust the location of the representative trace withannotation_x_min,annotation_x_max, etc. Or, you can choose to insert the representative trace as a separate geom using thepatchworkpackage (e.g. set up a two-row patchwork with the representative trace in the top row, and the summary plot in the second row).- legend_position_inside
A list of two numeric values describing the coordinates of the legend. This only applies if
legend_position = "inside".- included_sexes
A character value (
"both","male"or"female"). Useful if you want to have a plot with data from one sex only. Defaults to"both". If you choose a single sex, the resulting plot will have"-males-only"or"-females-only"in the file name. WARNING!! If you choose"male"or"female", you MUST ensure that thet_test_dfaccurately represents what you want to demonstrate: significance for both sexes grouped together (uset_test_df) or significance for each sex separately (uset_test_df_maleandt_test_df_femaleand adjust these heights usingstars_position_maleandstars_position_female).- male_label
A character value used to describe how males are encoded in the
sexcolumn of the dataframe used indata. This MUST match the value for male data in thesexcolumn, and it must be consistent across data sheets. Defaults to"Male".- female_label
A character value used to describe how females are encoded in the
sexcolumn of the dataframe used indata. This MUST match the value for female data in thesexcolumn, and it must be consistent across data sheets. This must be consistent in all data sheets. Defaults to"Female".- include_sex_in_legend
A character (
"yes"or"no") describing if the legend should include the sexes or just cell counts. For example, this determines if the legend will be "n = 3" or "Males, n = 3".- include_representative_trace
A character (
"yes"or"no") describing if a representative trace should be included as an overlay to the plot. This pulls from a png file stored inFigures/Representative-Traces/". Please specify the file-name inrepresentative_trace_filename.- representative_trace_filename
A character value describing the filename of the representative trace. This should be the name of a .png file. Use relative paths to specify files. For example, a figure in the
Figures/Representative-Tracessubfolder would be entered asrepresentative_trace_filename = "Figures/Representative-Traces/Category-2-Control-Trace.png".- position_dodge_size
A numeric value describing the distance that points should be dodged through
ggplot2::position_dodge(). Defaults to0.1.- annotation_x_min
A numeric value describing the minimum value on the x-axis for the representative trace. Defaults to
1, which will place it at the lower left corner of the plot (when combined with the default value forannotation_y_min).- annotation_x_max
A numeric value describing the maximum value on the x-axis for the representative trace. Change this if your representative trace image looks squished or stretched.
- annotation_y_min
A numeric value describing the minimum value on the y-axis for the representative trace. Defaults to
0, which will place it at the lower left corner of the plot (when combined with the default value forannotation_x_min).- annotation_y_max
A numeric value describing the maximum value on the y-axis for the representative trace. Change this if your representative trace image looks squished or stretched.
- y_axis_limit
A numeric value describing the maximum value on the y-axis.
- x_label
A character value specifying the x-axis label. Defaults to "Time (min)".
- signif_stars
A character (
"yes"or"no") describing if significance stars should be included as an overlay in the plot. If"yes", you must specify a dataframe containing the results of a t-test, which is generated usingperform_t_tests_for_summary_plot(). NOTE! Ifincluded_sexesis"male"or"female", you MUST use a t-test that was performed on data filtered to ONE sex.- significance_display_method
A character value (
"stars"or"p-value") describing how significance values should be displayed. These annotations will not appear ifsignif_starsis"no".)- geom_signif_text_size
A numeric value describing the size of the text annotations (significance stars or p-values) on the plot. Defaults to
8.- geom_signif_family
A character value describing the font family used for the p-value annotations used by
ggsignif::geom_signif(). Defaults to""(empty, will use default system font), but can be replaced with a named font. Use a package likeextrafontto load system fonts into R.- t_test_df
A dataframe of t-test results, which has been generated using
perform_t_tests_for_summary_plot(). Important note! The t-test dataframe must be filtered to match the same conditions in thedataargument, or the significance stars will be misleading. For example, if you want to show significance for both sexes as a group, use this. If you want to show male and female significance values separately, uset_test_df_maleandt_test_df_femaleand adjust their heights withstars_position_maleandstars_position_female. If you only have data for one sex, you could use either option.- t_test_df_male
A dataframe of t-test results (male only), which has been generated using
perform_t_tests_for_summary_plot(). This data has been filtered to only include male data before being put throughperform_t_tests_for_summary_plot().- t_test_df_female
A dataframe of t-test results (female only), which has been generated using
perform_t_tests_for_summary_plot(). This data has been filtered to only include female data before being put throughperform_t_tests_for_summary_plot().- stars_position
A numeric value stating the position on the y-axis of the significance stars. If you want to specify these for the sexes separately, use
stars_position_maleandstars_position_female. Defaults toNULLwhich automatically defaults toy_axis_limit - 50.- stars_position_male
A numeric value stating the position on the y-axis of the significance stars for the male data specified by
t_test_df_male. Defaults toNULLwhich sets it aty_axis_limit - 50.- stars_position_female
A numeric value stating the position on the y-axis of the significance stars for the male data specified by
t_test_df_female. Defaults toNULLwhich sets it aty_axis_limit - 75.- stars_colour
A character value (can be a hex code or a named R colour like
"red") describing the colour of the significance stars. Defaults to"Black".- stars_colour_male
A character value (can be a hex code or a named R colour like
"red") describing the colour of the significance stars for male data. Use only if you have put data int_test_df_male. Defaults to"Black".- stars_colour_female
A character value (can be a hex code or a named R colour like
"red") describing the colour of the significance stars for female data. Use only if you have put data int_test_df_female. Defaults to"Black".- large_axis_text
A character (
"yes"or"no"). If"yes", a ggplot theme layer will be applied which increases the size of the axis text.- shade_intervals
A character (
"yes"or"no"). If"yes", a ggplot theme layer will be applied which adds lightly shaded rectangles to highlight 5-minute intervals.- theme_options
A dataframe containing theme options. See sample_theme_options for an example of what this dataframe should look like.
- treatment_colour_theme
A dataframe containing treatment names and their associated colours as hex values. See sample_treatment_names_and_colours for an example of what this dataframe should look like.
- save_plot_png
A character (
"yes"or"no"). If"yes", the plot will be saved as a .png using ggsave. The filepath depends on the current type, but they will all go in subfolders belowFigures/in your project directory.- filename_suffix
Optional character value to add a suffix to the filename of the .png file created with this plot. Could be useful if you want to specify anything about the data (for example, to distinguish between recordings produced in MiniAnalysis vs. Clampfit).
- ggplot_theme
The name of a ggplot theme or your custom theme. This will be added as a layer to a ggplot object. The default is
patchclampplotteR_theme(), but other valid entries includetheme_bw(),theme_classic()or the name of a custom ggplot theme stored as an object.
Value
A ggplot object. If save_plot_png == "yes", it will also generate
a .png file exported to Figures/Evoked-currents/Output-summary-plots or
Figures/Spontaneous-currents/Output-summary-plots, depending on the
current_type. The .png filename will be in this format:
"Summary-plot-plot_treatment-category-plot_category-file_name_ending-text_size-sexes.png".
The text_size will only be added on if you are using large_axis_text
("LARGE" will be included in the filename). The file_name_ending will be
automatically added on for spontaneous current data to specify what
y_variable is plotted (e.g. "raw_amplitude"). The sexes will only be added if you choose to plot a single sex. For example, if you set included_sexes = "Male", the .png filename will have "-males-only" included in the filename.
Example auto-generated filenames include:
"Summary-plot-Control-category-2.png""Summary-plot-Control-category-2-males-only.png""Summary-plot-Control-category-2_raw_amplitude.png"for spontaneous currents.
See also
perform_t_tests_for_summary_plot() which produces the significance
stars appended to the plot.
make_pruned_EPSC_data() for the function that will produce the
summary data used in this plot.
Examples
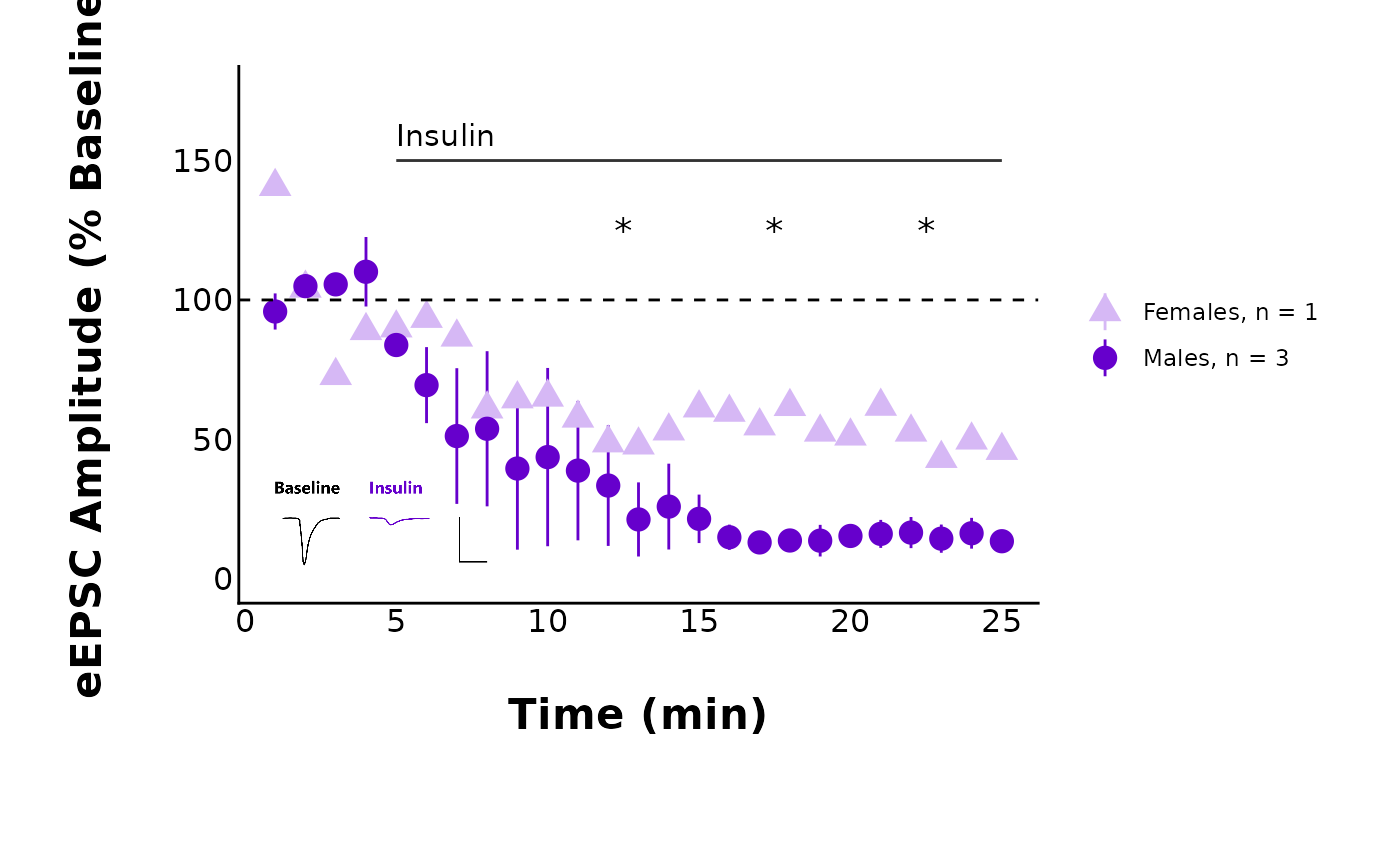
# Both sexes with significance stars for separate sexes
# Note: The significance stars are sample data
plot_summary_current_data(
data = sample_pruned_eEPSC_df$all_cells,
plot_category = 2,
plot_treatment = "Control",
current_type = "eEPSC",
y_variable = "amplitude",
hormone_added = "Insulin",
hormone_or_HFS_start_time = 5,
included_sexes = "both",
include_representative_trace = "yes",
representative_trace_filename = import_ext_data("Control-trace.png"),
y_axis_limit = 175,
signif_stars = "yes",
t_test_df_male = sample_eEPSC_t_test_df_male,
t_test_df_female = sample_eEPSC_t_test_df_female,
stars_position_male = 30,
stars_position_female = 70,
stars_colour_male = "#6600cc",
stars_colour_female = "#d6b8f5",
large_axis_text = "no",
shade_intervals = "no",
treatment_colour_theme = sample_treatment_names_and_colours,
theme_options = sample_theme_options
)
#> Warning: Removed 25 rows containing missing values or values outside the scale range
#> (`geom_segment()`).
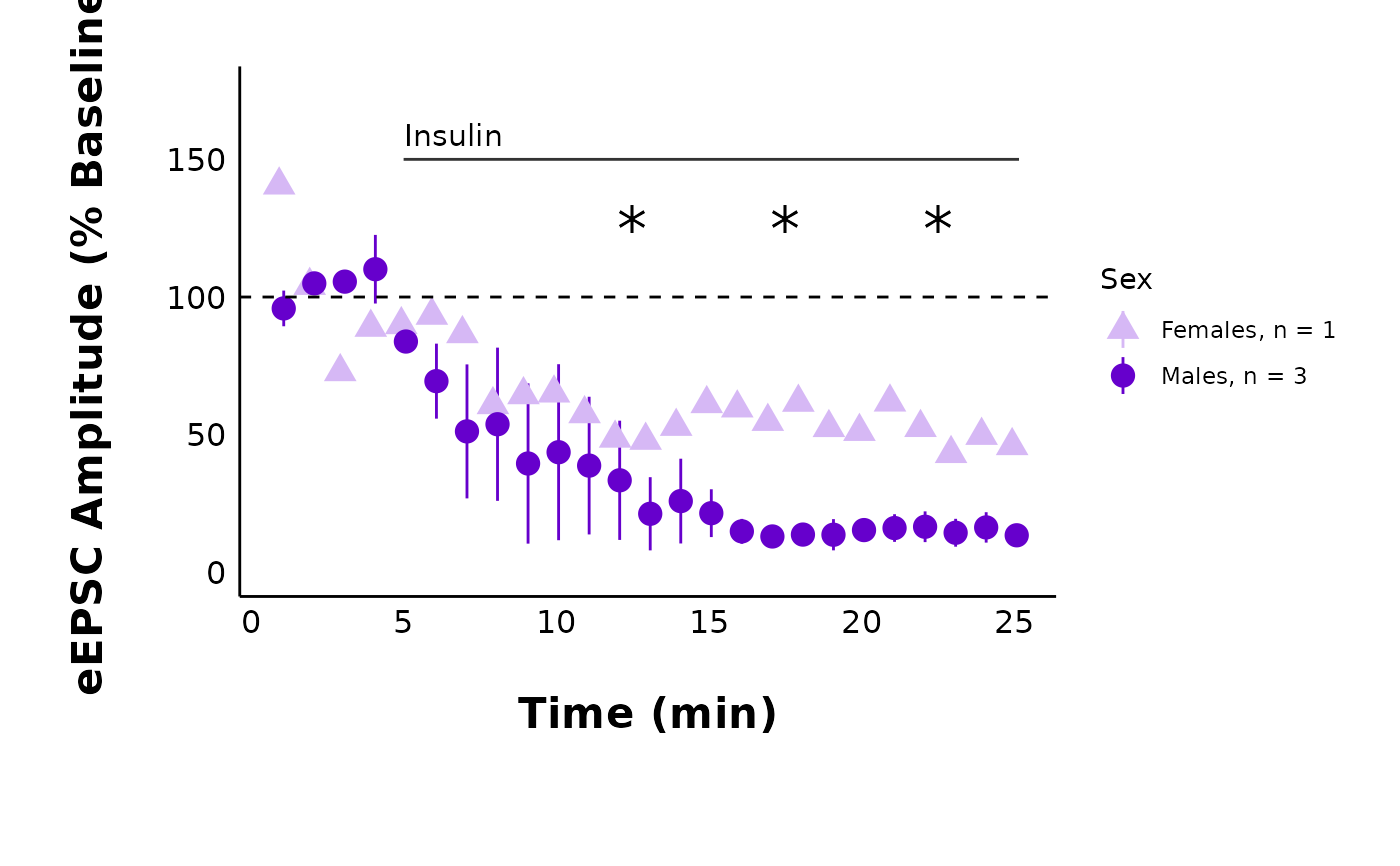 # Both sexes with significance stars from grouped data
plot_summary_current_data(
data = sample_pruned_eEPSC_df$all_cells,
plot_category = 2,
plot_treatment = "Control",
current_type = "eEPSC",
y_variable = "amplitude",
hormone_added = "Insulin",
hormone_or_HFS_start_time = 5,
included_sexes = "both",
include_representative_trace = "yes",
representative_trace_filename = import_ext_data("Control-trace.png"),
y_axis_limit = 175,
signif_stars = "yes",
t_test_df = sample_eEPSC_t_test_df,
large_axis_text = "no",
shade_intervals = "no",
treatment_colour_theme = sample_treatment_names_and_colours,
theme_options = sample_theme_options
)
#> Warning: Removed 25 rows containing missing values or values outside the scale range
#> (`geom_segment()`).
# Both sexes with significance stars from grouped data
plot_summary_current_data(
data = sample_pruned_eEPSC_df$all_cells,
plot_category = 2,
plot_treatment = "Control",
current_type = "eEPSC",
y_variable = "amplitude",
hormone_added = "Insulin",
hormone_or_HFS_start_time = 5,
included_sexes = "both",
include_representative_trace = "yes",
representative_trace_filename = import_ext_data("Control-trace.png"),
y_axis_limit = 175,
signif_stars = "yes",
t_test_df = sample_eEPSC_t_test_df,
large_axis_text = "no",
shade_intervals = "no",
treatment_colour_theme = sample_treatment_names_and_colours,
theme_options = sample_theme_options
)
#> Warning: Removed 25 rows containing missing values or values outside the scale range
#> (`geom_segment()`).