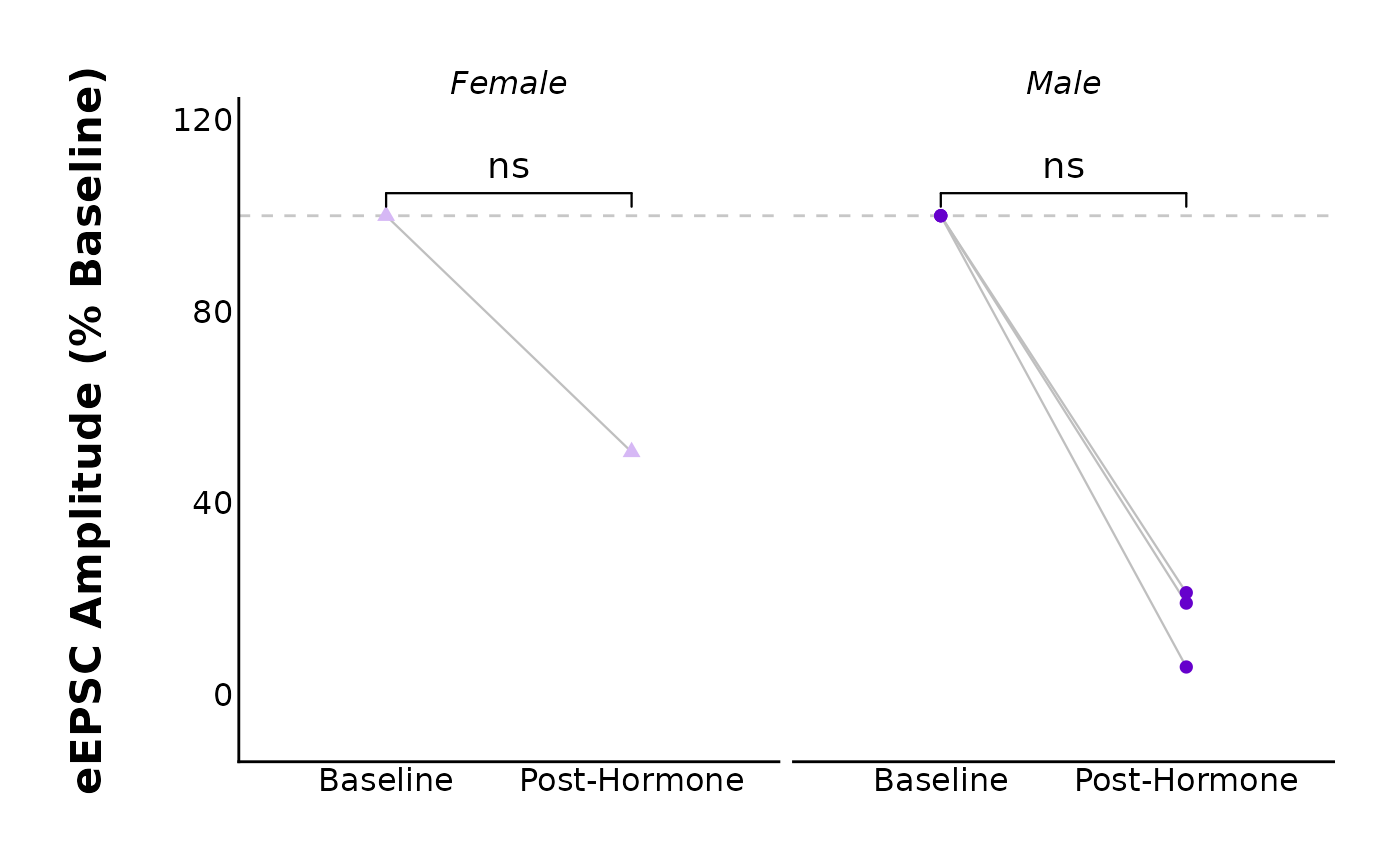
return_p_value_as_stars() is useful to display p-values in a plot. It inserts into the map_signif_level_values argument of any plotting function in this patchclampplotteR package (which is really the map_signif_level of ggsignif::geom_signif()). map_signif_level_values = FALSE or map_signif_level_values = TRUE will display only stars or only numbers. This function will display stars for values <= 0.05 like usual, but it will display raw numeric values is the p-value is between 0.05 and 0.1. This is for transparency when significance values are close to 0.05 threshold. The upper threshold can be adjusted.
Examples
# Simplest use
# Use for `map_signif_level_values`
# in any plotting function in `patchclampplotteR`.
# This will use the default `upper_threshold` value of 0.1.
plot_change_as_connected_lines(
data = sample_summary_eEPSC_df$summary_data,
plot_treatment = "Control",
plot_category = 2,
included_sexes = "both",
map_signif_level_values = return_p_value_as_stars,
post_hormone_interval = "t20to25",
theme_options = sample_theme_options,
treatment_colour_theme = sample_treatment_names_and_colours
)
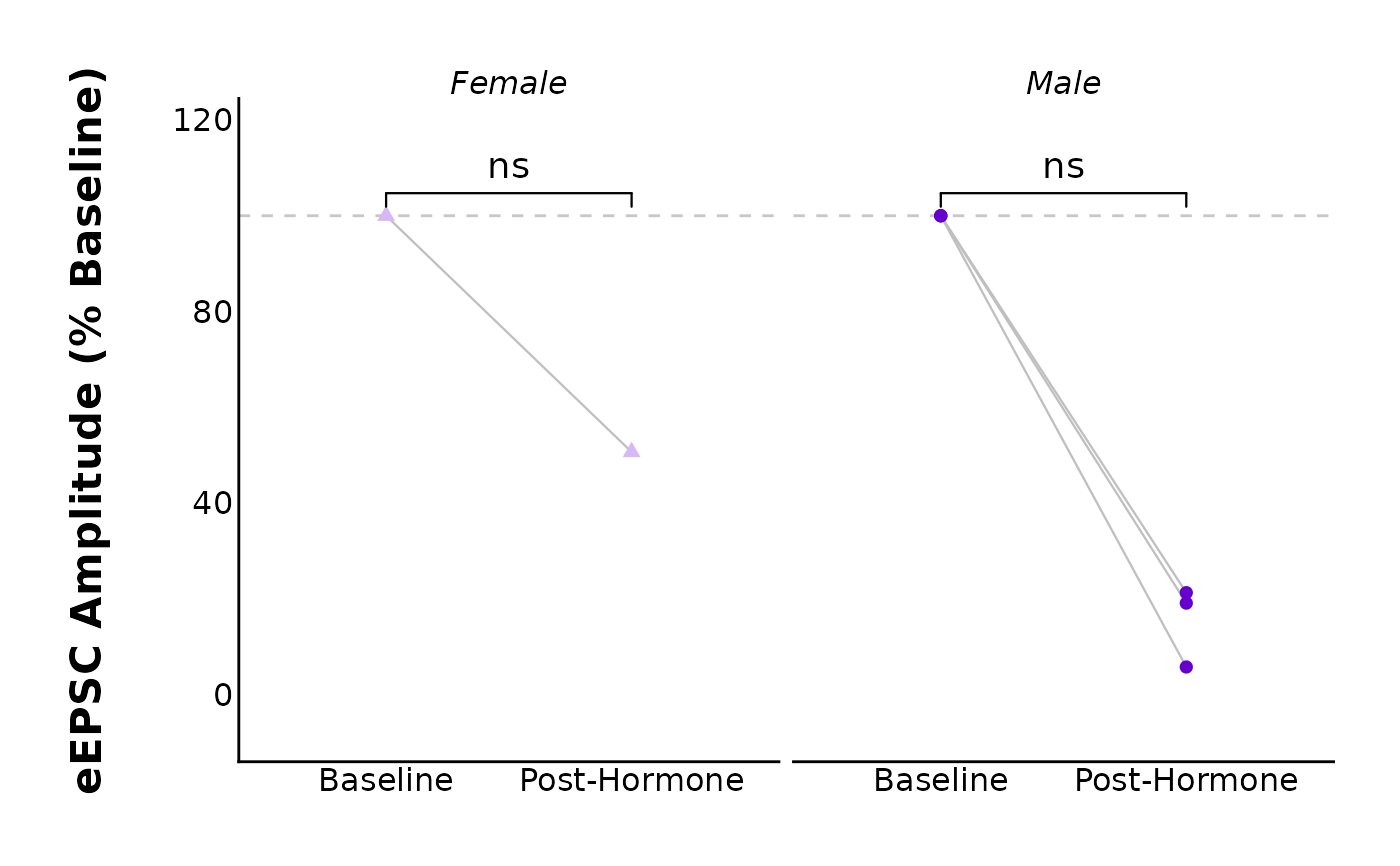 # Change upper_threshold
# To change this value, you must use an anonymous function
# because `map_signif_level` requires a numeric, single argument `p`.
plot_change_as_connected_lines(
data = sample_summary_eEPSC_df$summary_data,
plot_treatment = "Control",
plot_category = 2,
included_sexes = "both",
map_signif_level_values = function(p) {
return_p_value_as_stars(p,
upper_threshold = 0.2
)
},
post_hormone_interval = "t20to25",
theme_options = sample_theme_options,
treatment_colour_theme = sample_treatment_names_and_colours
)
# Change upper_threshold
# To change this value, you must use an anonymous function
# because `map_signif_level` requires a numeric, single argument `p`.
plot_change_as_connected_lines(
data = sample_summary_eEPSC_df$summary_data,
plot_treatment = "Control",
plot_category = 2,
included_sexes = "both",
map_signif_level_values = function(p) {
return_p_value_as_stars(p,
upper_threshold = 0.2
)
},
post_hormone_interval = "t20to25",
theme_options = sample_theme_options,
treatment_colour_theme = sample_treatment_names_and_colours
)